Indexed In
- Open J Gate
- RefSeek
- Hamdard University
- EBSCO A-Z
- OCLC- WorldCat
- Publons
- International Scientific Indexing
- Euro Pub
- Google Scholar
Useful Links
Share This Page
Journal Flyer

Open Access Journals
- Agri and Aquaculture
- Biochemistry
- Bioinformatics & Systems Biology
- Business & Management
- Chemistry
- Clinical Sciences
- Engineering
- Food & Nutrition
- General Science
- Genetics & Molecular Biology
- Immunology & Microbiology
- Medical Sciences
- Neuroscience & Psychology
- Nursing & Health Care
- Pharmaceutical Sciences
Research Article - (2020) Volume 9, Issue 3
Geospatial Tools for Suitable Assessment of Small Holder Irrigation Water, towards Increased Food Production and Poverty Eradicationin Nigeria: A Case of Jos East LGA. Plateau State
Ibrahim ES1,2,3*, Gajere EN1, Dang BA1, Jerome1, Dashan T1, Mwada H1 and Ojih S12Leibniz Centre for Agricultural Landscape Research (ZALF), Müncheberg, Germany
3Earth Observation Lab, Geography Institute, Faculty of Mathematics and Natural Sciences, Humboldt University of Berlin, Berlin, Germany
Received: 06-May-2020 Published: 27-May-2020, DOI: 10.35248/2469-4134.20.9.274
Abstract
Irrigation is very crucial for sustaining global food security and poverty reduction, especially during off season food production in developing countries. Plateau state in recent years is exploring extensive irrigation schemes to meet up overwhelming national demands of exotic temperate crops and vegetables. The local farmers relyon seasonal streams and abandoned mine ponds for irrigating their crops, but water in these sources are exhausted easily, leading to increased yield losses. This research explores geoinformation methods to map, select and quantify suitable areas to site reservoirs for sustainable Small Holder Irrigation in Jos East LGA of Plateau state as a case study. Spatial Multi Criteria Analysis (SMCA) and other quantitative tools were employed for the spatial modeling and subsequent analysis. The results revealed that 11 sites are highly suitable in Jos East. Volumetric analysis was carried out to estimate potential water collection capabilities of these reservoirs, and the water prospect is estimated between ~172,660 m3 to ~13,929,275 m3, this was based on the calculated depth, and surface area of the prospective reservoirs. Subsequently, this model can be replicated in other parts of Plateau state, Nigeria and Africa with similar environmental, climatic conditions and water demands. We propose small reservoirs with simple engineering techniques to serve poor local communities in developing countries, which can alleviate poverty and enhance sustainable agricultural production. The initiative is in line with FAO’s and World Bank’s programs and recommendations, and which can promote pragmatic solutions and guide project allocations in line with Sustainable Development Goals (SDGs).
Keywords
Spatial; Geoinformation; Suitability; Irrigation; Reservoirs; Food-securityIntroduction
Background
The agricultural sector in Nigeria has always been a branch of the economy and providing employment for about 30% of the population (Nigerian Bureau of Statistics, 2010). Yet most Nigerian farmers are poor and merely engage in subsistence farming to provide food for their families and very little is made available to the market [1]. Recently, agriculture in Nigeria has improved due to advent of technology and economic policies driving food production. Farmers are stepping away from subsistence agriculture and embracing modern farming techniques and irrigation schemes, with investments in large scale farming which is ultimately increasing agricultural out puts (output) (APP Report, 2016). However, with the soil and climatic condition being very suitable for wide varieties of crops, food production can be done throughout the year, but water challenge has impeded irrigation agriculture in Nigeria. There is a need to maximize small holder irrigation schemes to promote dual food production in a bid to reduce hunger and poverty in Nigeria. World Bank, (2011) hasal ready highlighted that better water management for smallholder farming in Sub-Saharan Africa leads to larger yields and increased farmers’ income.
Scope of Study
The tropical climate in Nigeria limits production of exotic temperate crops and vegetables. Often, these crops and vegetables are in short supply in Nigeria, leading to increased importation and high prices of these crops, fruits and vegetables. Although tropical highlands are used for such production, taking advantage of their conducive climate conditions, there area few of such locations in Nigeria. Hence climate conditions attached to these crops has obstructed the expansion of producing exotic vegetables, fruits and crops in Nigeria. Plateau state is one of the major tropical highlands and enjoys a more temperate climate compared to the other parts of Nigeria, usually an average temperature is between 21-25°C. Hence Plateau state is the focal location in Nigeria saddled with the responsibility of producing temperate crops and vegetables in large quantities. The State is legendary for the production of crops and fruits such as; potatoes, apples, grapes, wheat, barley, strawberry, and vegetables such as broccoli, radish cauliflower, celery, carrot, cucumber, broccoli, strawberry, cabbage, asparagus, spinach, lettuce, etc. Regrettably, peasant farmers in this region are sole producers of these crops and production is on subsistence quantities.
Recently farmers in Plateau state are intensifying efforts to maximize agricultural production. Although the major constraint island availability due to wide-spread of rocks in the northern parts where temperature is cooler and the shortage of water supply for irrigation in the areas where these crops can be produced. The state attained the name “Plateau” from the Jos Plateau, a mountainous area in the northern area of the state, with captivating rock formations and altitude ranging from around 1,200 m to a peak of 1,829 m above sea level (Figure 1). The Jos Plateau is the source of many rivers in northern Nigeria including the Kaduna, Gongola, Hadejia and Yobe rivers. This gives the potential to collect water for irrigation purposes. Presently about 40,000 Ha is under irrigation in Plateau state (Natural Resource and Development, 2016). Irrigation water is derived from dams, seasonal streams/rivers and old mine ponds. Majority of the natural streams, rivers and ponds are seasonal, leading to critical water shortages affecting crop yields. Therefore, there is need to identify more areas in the state where water can be collected for off season farming activities. This will enhance food production in the state and the country at large. However, undulating topographical features and exhaustive field data measurements often limits these surveys, they are usually time and cost intensive. Geographic Information System (GIS) considerably reduces economic burdens, workload and time in calculating dam/reservoirs areas and capacities manually [2].
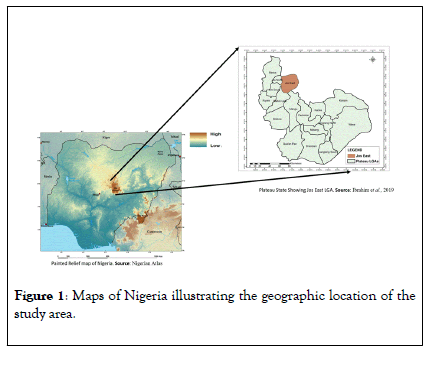
Figure 1: Maps of Nigeria illustrating the geographic location of the study area.
Spatial Multiple Criteria Analysis (SMCA)
GIS with the aid of remote sensing data, provides accurate estimations of dam/reservoirs volumes and water surface areas. This is more accurate, reliable, cost and time effective compared to other conventional methods [3]. Advance site selection is made through a combination of several factors to select an optimal option considering the influence of all the factors. This is referred to Multiple Criteria Analysis (MCA), it is a framework for ranking or scoring the general performance of decision options against multiple objectives [3]. It can be integrated into a spatial framework using Geographic Information System (GIS) and has become a robust tool used for suitability site selection analysis referred to as Spatial Multiple Criteria Analysis (SMCA) [4]. SMCA have the potential to moderate the costs and time involved in siting amenities by narrowing the potential choices based on predefined criteria and weights, this also permits sensitivity analysis of the results from these processes [4]. The technique is applicable in diverse fields; landfill sites [5,6], waste disposal [7],energy [8-10] also in water resource management [3]. Hajkowicz and Collins reviewed MCA in water resources management and discussed about 113 published water management MCA studies from 34 countries. In irrigation water management, there have been several SMCA efforts over the past decades [11-14]. The SMCA technique is explored in the current research to identify areas suitable for small holder reservoirs for dry season farming in rural landscapes in Nigeria. Methods are expanded to also estimate potential water collection in these reservoirs.
Study Area
The case study area is Jos East LGA of Plateau State Nigeria with a land area of about 907.2 km2 and an estimated population of 82,260 people based on 2006 population census. About 80% of this population are rural based and the remaining 20% live in the semi-urban centers (NPC, 2005). The rural settlers engage in farming as their main occupation while those in the semi- urban areas are either artisans or civil servants working in government establishments clustered around the area. The LGA comprises of 11 political wards and 6 political districts (NPC, 2005). Crops and vegetables such as; Tomatoes, Maize, Millet, rice, pepper, cucumber, cabbage, okra, peas, green beans are cultivated in commercial quantities. The area is completely captured within the Maijuju rock formation with an elevation between 577 m to 1752 m.
Data And Methods
The data for the SMC modeling and other analysis, with sources and their potential uses are shown in Table 1.The methodological aspect of research is categorized into three sections: (i) the generation of factor maps and subsequently SMC modeling, (ii) the estimation of water collection potentials in optimal sites, and (iii)field work and validation of model performance.
| Data Type | Derivable | Source | Scale/Resolution | Date |
|---|---|---|---|---|
| Rainfall | Rainfall Map | http://www.unidata.ucar.edu/namespaces/netcdf/ncml-2.2 | - | Jul-16 |
| Water bodies | Streams and Rivers, | National Center for Remote Sensing (NCRS) | 1:50000 | 2017 |
| NigeriaSat-X | Land Use/Land Cover (LULC) | National Space Research and Development Agency (NASRDA) | 22 m in multi-spectral bands ( red, blue, green and near inferred-red) | Nov-2 (2010) |
| LandSat-8 | Land Surface Temperature (LST) | Global Land cover Facility(GLCF) | 30 m Thermal Bands (Bands 10 and 11) | April 4th 2017 |
| Shuttle Radar Topographic Mission (SRTM) | For elevation, slope, terrain and catchment analysis | Global Land Cover Facility (GLCF) | 30 m | - |
| Roads | Accessibility | National Space Research and Development Agency (NASRDA) | 1:50,000 | 2012 |
| Administrative Boundaries | LGA and Political Ward | Plateau State Ministry of lands and Survey | 1:250,000 | 2005 |
| Soil map | Soil Type | Food and Agriculture Organization (FAO)-UNESCO | - | 1971-1981 |
| Geology Map | Geology | Nigerian Geological Survey (NGS) | 1:500,000 | 2006 |
Table 1: Data Sources.
Spatial multi-criteria modelling
Factors such as flow characteristics, indices of flow, human disturbances, flood frequencies, peak average and annual discharges were used previously for SMCA to model suitable sites for water collection [15,16]. Recently simple spatial data (elevation, slope stability, geology, Land cover, etc) are explored for the same analysis and results achieved are comparable with previous practices [2].Therefore we considered 11 environmental, social and economic factors to select the optimal locations to harvest water for irrigation purpose in Jos East LGA of Plateau State Nigeria. The factors are; land cover, soil, geology, flow accumulation, elevation, land surface temperature and rainfall, slope, existing roads, existing streams and rivers (Figure 2). These factors were generated as maps using the different methods described below:
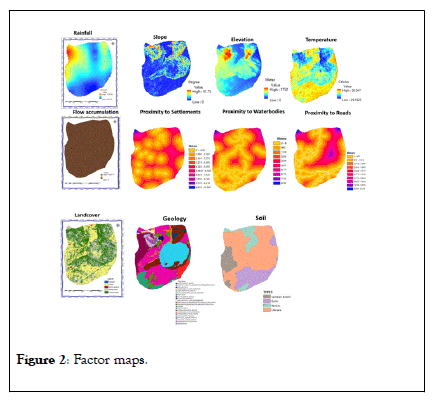
Figure 2: Factor maps.
Rainfall map: The downloaded rainfall point shape file comprises six points around plateau state. The points were interpolated to generate a raster rainfall map of Jos East LGA (Figure 2).Areas with higher rainfall were considered more suitable and are as with lower rainfall was considered less suitable (Figure 3).
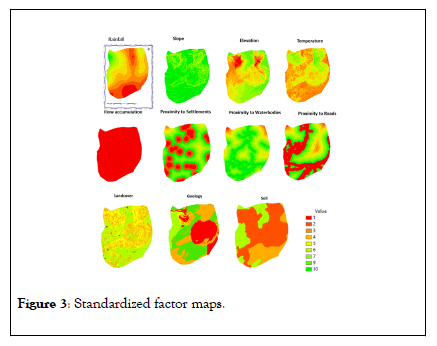
Figure 3: Standardized factor maps.
Proximities to water bodies, settlements and road: A “ Euclidean Distance ” operation was performed to generate raster buffers around existing water bodies, settlements and roads (Figure 2). In consideration for safety, areas closest to the roads were considered unsuitable, likewise, areas farthest from roads for the purposes of accessibility and cost were considered less suitable. The same consideration was also applied to settlement proximities, the areas closest to existing settlements were considered less suitable for safety purposes and areas farthest from settlements were considered less suitable for cost of transportation. On the contrary, areas closest to existing water bodies were considered more suitable than areas farthest from existing water bodies (Figure 3).
Land cover and Land use: We classified the Nigeria-Sat X data using maximum likelihood algorithm of the supervised classification [16]. Five broad LULC classes were produced and namely; Vegetation, Water, Cultivated land, Rocks/Bare and Settlements (Figure 2). Emphasis evaluates current land availability and uses across the landscape in Jos East. The class water (streams, ponds and rivers) were considered optimally suitable, farms were considered very suitable, vegetated areas were considered suitable, bare rocks and surfaces were considered unsuitable and Settlements restricted from the analysis (Figure 3).
Elevation and Slope: The information on elevation is available in the downloaded SRTM data format. The purpose of the elevation data is to categorize areas with high elevations which are in most cases rock formations and not suitable for siting reservoirs. On the contrary, floodplains and depressions (lowest elevations) were classified most suitable for siting reservoirs (Figures 2,3). Slope in degrees was also generated from the SRTM data. The slope factor is among the economic factors, considering engineering construction and cost, therefore areas on steep slopes were considered less suitable and areas on gentle slopes considered very suitable.
Flow Accumulation: The flow accumulation map was generated using SRTM data. Flow accumulation estimates a cumulative count of pixels that naturally drain into different outlets after rainfall. The flow accumulation factor was considered to establish potential locations with high rainfall water accumulation, in some instances the river network order is used to achieve the same goal [2]. Areas with high accumulation potentials were considered highly suitable, while areas with little water accumulation potential were considered unsuitable.
Land Surface Temperatures (LST): LST is land radioactive temperature derived from solar radiation and can be estimated from satellite data with respective bands. Generating LST using Lands at data has evolved with the two thermal bands in Landsat-8. LST methods have also evolved from simple procedures to more complex but near accurate methods. Recent methods entail the incorporation of Land cover map or generated Normalized Differential Vegetation Index (NDVI) [11,17]. Five Landsat-8 bands are required; bands 3, 4 and 5 for Land cover mapping, bands 4 and 5 for NDVI analysis and bands 10 and 11 for the main thermal analysis. LST methods were adopted and it entails five major equations to estimate LST, April 2017 data was selected for the analysis, which is the peak heat period in Plateau state [17]. First Top of Atmosphere (TOA) Radiance was estimated, then converted Top of Atmosphere (TOA) to Brightness Temperature (BT), then NDVI generated for Land Surface Emissivity (LSE).The LSE is processed with BT to produce the final LST map. The LST is estimated using bands 10 and 11 separately and later averaged to obtain the mean temperatures from the two bands. The generated LST is measured in Kelvin and can easily be converted to degree Celsius. The areas with higher surface temperatures were considered less suitable and areas with lower temperatures were considered more suitable.
Soil and Geology: The digitized geology map was categorized into suitability classes. The soil layer from FAO was used to categorize soils suitability for retaining water in Jos East. Although majorly the soil classes in the area are not very suitable for damming water.
In general, the 11 factors considered can be grouped into three broad segments, Social (roads and settlements), Economic (roads, slope and rocks) and lastly Environmental/climatic (rainfall, temperature, elevation, soil, geology and land cover). Even though emphasis is the ecological/environmental component. Subsequent analysis was the suitability ranking of the individual factor maps [18-22]. Each factor was standardized to a common scale of measurement. Allmaps were reclassified to anexplicit ranking format (1-10 classes), this is to support assigning a significance and impact to each factor. These factor maps illustrate suitability of a specified factor in a graduating scale, ranging from “not suitable and restrictions” (0), to “less suitable” (1-3), to “suitable”(4-6) and “highly suitable” (7-10). This implies that, the higher the suitable value, the more the suitability to site a reservoir (Figure 3).
Constraints (0) are exclusions which delineates unsuitable areas due to ecological, terrain, religious, social and economic reasons. The constraint as includes the existing settlements and protected areas.
The last analysis in this section is the multi-criteria analysis and weighted overlay operation. The factors considered were not of equal importance, therefore all factors were weighted according to their significance and thereby assigning each a percentage of influence and summing influence to 100% (Table 2) [2].The higher the percentage, the more the influence a particular criterion will have in relation to other criteria under consideration. Land cover, soil and geology were assigned highest percentages of influence, while rainfall and temperature were assigned the lowest percentage of influence. This is because rainfall variation in the area is minor (1157 mm -1255 mm). On the part of the LST, the variation on the lower areas was also insignificant (29.5°C-34°C) [23-27]. An output value of the resultant maps (final suitability map) was produced using ‘weighted overlay’ Spatial Analyst tool in Arc Map. This tool executes a mathematical expression of adding multiple raster intersections with a shared measurement scale, and weighting each according to its significance to produce a final suitable map. The suitability index of the final map shows a range of 0-10, 0 showing restricted areas and values from 1-10 are indicating suitability ranking in ascending order.
| S/No | Criterion | Percentage of influence |
|---|---|---|
| 1 | LULC | 17 |
| 2 | Soil | 15 |
| 3 | Geology | 15 |
| 4 | Flow accumulation | 8 |
| 5 | Elevation | 10 |
| 6 | Rainfall | 3 |
| 7 | Slope | 5 |
| 8 | Land Surface Temperature (LST) | 2 |
| 9 | Proximity to Road | 5 |
| 10 | Proximity to Settlement | 10 |
| 11 | Proximity to streams and rivers | 10 |
| Total | 100 |
Table 2: Weighting of factor maps.
Estimating potential water volume
Simpler spatial data and methods of estimating potential water in a reservoir/lake has been established. The required data for the analysis are reservoir are and maximum-minimum depths. The results from these analysis have shown equivalent accuracies compared to complex models. As such, we adopted their methods using optimal sites from our analysis as reservoir shape files and deducting water depth from the sites elevation data (Figure 4).The expressions was employed in “ R-Studio ” to generate the cell depth, water volume at different crest levels and the aggregate total water volume. This operation was carried out for all the potential sites and the end result shows total volume of water in cubic meters for each of the proposed reservoir [28-32].
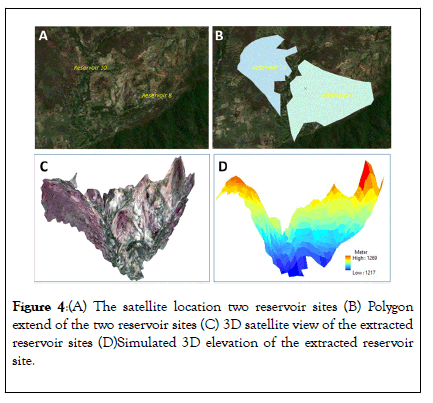
Figure 4: (A) The satellite location two reservoir sites (B) Polygon extend of the two reservoir sites (C) 3D satellite view of the extracted reservoir sites (D)Simulated 3D elevation of the extracted reservoir site.
Model assessment and validation
Sensitivity analysis of the model is recommended to test the result from these vigorous processes [2]. The optical sites were first over laid on the land cover, elevation, soil, geology, existing water bodies and roads to evaluate model performance. Best reservoir sites were converted to KMZ and also viewed on Google Earth. Ultimately these points were uploaded into a GPS and these locations were visited for field validation.
Results and Discussion
Spatial multi-criteria modeling
The final suitability map was expected to show a value map of 0-10, however based on the assigned factors and weights, the map produced the following values 0, 3, 4, 5, 6, 7 and 8 (Figure 4A). This implies that the algorithm could not calculate an area in Jos East with an absolute suitability factor between 9-10 and a complete unsuitability factor of 1-2. The final suitability values were translated to suitability classes; starting from restricted area (0), to unsuitable (3-4), to likely and suitable (5-8) (Figure 4B). Hence the highest suitability value achieved was 8, we hereby accept the areas with the value of 8 as the most suitable areas to site reservoirs in Jos East LGA. Areas under restriction covers about 775 ha, these are mainly existing settlements which were excluded from the analysis. While about 537 ha of land were classified as very unsuitable, these are mainly mountain peaks and bare rocks. While 18,206 ha falls within the unsuitable areas, with observations these falls within the existing dense woody and shrubby lands, as such were categorized as areas unsuitable for ecological purposes. Areas within the likely suitable sites covers a total of 34,992 ha. The locations within the suitable and very suitable classes covers an area of 25,169 ha and 10,239 ha respectively Table 3. The areas identified as optimally suitable has the least area coverage, with a total area of 212 ha. These are observed to fall largely within the existing farmlands (Figure 5).
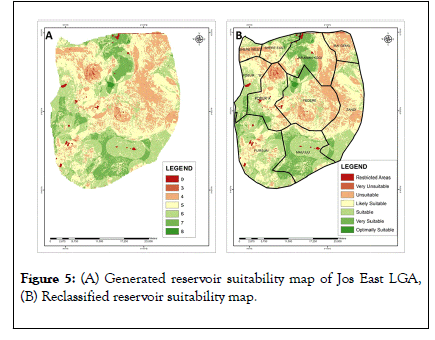
Figure 5: (A) Generated reservoir suitability map of Jos East LGA, (B) Reclassified reservoir suitability map.
| Suitability Value | Suitability Class | Area (Ha) | Percentage |
|---|---|---|---|
| 0 | Restricted Areas | 775 | 0.9 |
| 3 | Very Unsuitable | 537 | 0.6 |
| 4 | Unsuitable | 18206 | 20.2 |
| 5 | Likely Suitable | 34992 | 38.8 |
| 6 | Suitable | 25169 | 27.9 |
| 7 | Very Suitable | 10239 | 11.4 |
| 8 | Optimally Suitable | 212 | 0.2 |
| TOTAL | 90131 | 100 |
Table 3: Area coverage of the Suitability classification.
The optimal sites are largely distributed on the northern, western and southern parts of the LGA, with more concentration on the southern parts (Figure 6A). An overlay of the extracted optimal sites shows that 5 political wards (FoburA, Fursum, Federe, JarawanKogi and Maijuju) out of the 10 wards were captured within this category as shown in Table 4. On the other hand, S here West, S here East, Fobur B, Zandi and Maigemu wards were not captured within the optimal sites. Although all were captured within the very suitable category (suitability value 7), with very small patches in Maigemuward. Zandi, Shere West and Maigemuwards have the least potential and can be attributed to the impact of elevation and bare rock formations dominant in these areas. While Maijuju ward has the largest potential, with about 5 out of the 11 optimal sites located within this ward. Followed by Zandi with one dominant reservoir falling within the ward, but about four more sites from Fobur B and Maijuju cutting across this ward. Further observation shows that Maijujuward is located on the lower flood plains with a range of river catchments within this area. In theory, the reservoirs in Maijuju can also serve the communities in the southern parts of Federe ward. Optimally these kinds of analysis further depict the significance of GIS as an unbiased and reliable tool for government allocations aimed at informed policy decisions and also implementations of global intervention agendas such as FAO, World Bank and UN programs. Usually these allocations are influenced by political agendas and in sometimes biased.
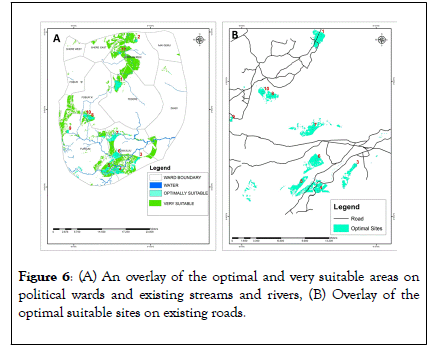
Figure 6: (A) An overlay of the optimal and very suitable areas on political wards and existing streams and rivers, (B) Overlay of the optimal suitable sites on existing roads.
Estimating potential water volume
Having selected the optimal locations, water potentials were estimated. The approximations are based on the estimated sizes and reservoir depths as discussed earlier. The water potential at different crest levels are summed to illustrate water potential at all proposed optimal reservoir locations (Table 4). Reservoir 11 has the least size of ~17 ha and reservoir depth from ~1-18 m, as such it shows the least water potential of ~172,660 m3. On the other hand, reservoir 7 has the largest potential size of ~472 ha and also the largest water depth from ~1-133 m, hence it hosts the largest estimated water potential in Jos East LGA (~13,929,275). Other than these two extreme cases, the estimated potential is between ~230,000-530,000 m3 in the remaining 9 sites. Results reveals that reservoir 8 and 10 are located close to each other, as such can be merged to construct one large reservoir. Similarly reservoir 4, 5 and 6 p’can be nested together and to construct one large reservoir to serve more communities if large dams are preferred. Other locations are sites isolated from other sites (1, 9 and 7).
| Site Name | Political ward | Size | Reservoir Depth (Meter) | Estimated Water Volume (Cubic meter) |
|---|---|---|---|---|
| (Ha) | ||||
| Reservoir 1 | Federe | 281.3 | 1 – 73 | 2,32,996 |
| Reservoir 2 | JarawanKogi | 31.3 | 2 – 65 | 3,63,152 |
| Reservoir 3 | Maijuju | 213.7 | 1 – 52 | 5,30,430 |
| Reservoir 4 | Maijuju and Fursum | 467.4 | 2 – 50 | 5,12,680 |
| Reservoir 5 | Maijuju and Fursum | 238.4 | 1 – 37 | 3,40,807 |
| Reservoir 6 | Maijuju | 354 | 3 – 42 | 4,47,050 |
| Reservoir 7 | Maijuju and Fursum | 471.9 | 1 – 133 | ######## |
| Reservoir 8 | Fobur A and Fursum | 185 | 1 – 47 | 2,43,464 |
| Reservoir 9 | Fursum | 26 | 3 – 23 | 3,90,215 |
| Reservoir 10 | Fobur A | 110.9 | 2 – 39 | 5,16,291 |
| and Fursum | ||||
| Reservoir 11 | JarawanKogi | 16.8 | 1 – 18 | 1,72,660 |
Table 4: Estimated depth and water potential of the optimal reservoirs.
Irrigation water requirement for wheat, barley, maize, potatoes, sugar beet, cowpea, soybeans, sunflower, and vegetables to be ~8876 to 15977 m3 [18]. With our potential water estimations, reservoir 11 with the least water potential (172, 660 m3) can irrigate ~10.8 to 19.4 ha of land annually. While, on the average (230, 000 m3), the potential irrigation capacity is 14 to 26 ha, whereas 530, 000 m3 can potentially irrigate from 33 to 62 ha annually. Eventhough reported that 2,700 m3 is the general potential water required per ha for farmable land in Nigeria [19]. Because Nigeria is reported to have lower water requirement per farmable land, but crop specifics were not provided in their estimates. Going forward, there is need to explore GIS capabilities to estimate and model irrigation water requirement at farm levels using GIS. This has been tested for different regions; India [11], Iraq [12], Bangladesh [13], England [14] and so on. Authors have recommended this tool for easy and reliable management of water for irrigation and increased food production. Spatio-temporal variations of local climate, soil, land use and irrigation practice are equally used as inputs for the water management analysis.
Results reveal that some reservoirs with large surface sizes and wide depth range show low water collection potentials (e.g. reservoir 1, 8 and 10), this is because of elevation and depths at crest water levels (Figure 7). The depths of the shallow crest levels are more than the deeper parts of the reservoir (Figures 4 C,D and 8). Further excavations can be done in such instances for intensified water potential. While reservoir 2 and 9 are highly recommendable, this is because they cover a small surface area of 31.3 ha and 26 ha respectively, but show(s) high water collection potential which is influenced by high depth at all crest levels. These are highly recommend able, ultimately, our research idea is for small scale reservoirs, the focus is to generate water on small local scales with little engineering and minimal fund allocations to enhance local food production amongst rural people. This is in line with discussions by FAO, (2014) and World Bank, (2011),with a goal to eradicate poverty and hunger in developing countries. These organizations have made strong recommendations for such schemes and have supported local communities in this aspect. With interventions in pumping tools, subsidies, etc in West Africa, including Nigeria, and they have identified a need for sustainable sources of water towards the total achievements of these programs. Therefore, these methods can be used to recommend suitable areas to site small scale reservoirs to help individuals and farmer groups.
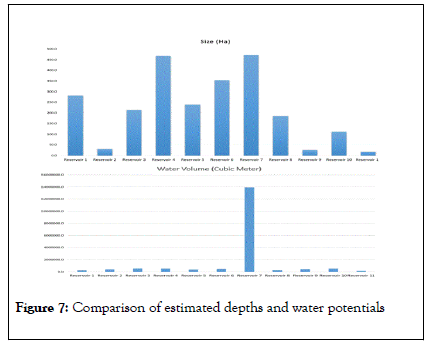
Figure 7:Comparison of estimated depths and water potentials
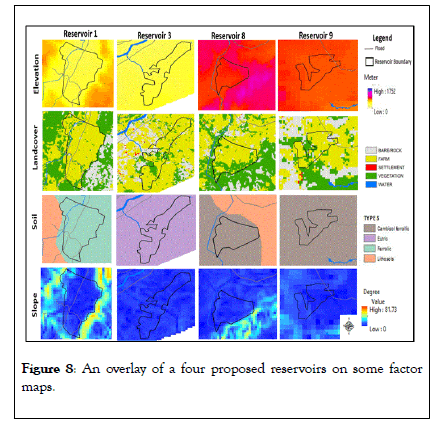
Figure 8: An overlay of a four proposed reservoirs on some factor maps.
Model validation, field observation and water demand
Validation with spatial data and factor maps: As expected, the suitability map shows that ranking assigned in Table 1 was highly significant in the generation of the final result (Figure 8). The best suitable areas were mostly explained by the three most significant factors assigned higher ranking. Land cover with a ranking of 17% was however by far the most crucial factor explaining the suitability map. Most of the suitable areas are located on farmlands and vegetated areas. Soil and geology with a ranking of 15% each, were also significantly explaining the suitability map. The impact of proximities to settlements, roads and rivers also significantly shows on the final map. The optimal sites are located close to existing roads but not too close or on the existing roads. This is with exception of sites 1 and 4 (Figures 6B, 8). This factor could have been over ruled by the significance of other dominant factors like Land cover, elevation, soil and geology. For reservoirs 1 and 4, an option is to construct on the southern part of the proposed sites to avoid the intersected roads. Of most importance, the proposed reservoirs were located close to existing rivers and streams but not intersecting the waters bodies, with the exception of sites 1, 4, 5, and 8. This is good because it will significantly reduce downstream effects. As settlements along downstream will be affected if the streams are confined upland to construct a reservoir. All optimal sites are located on lower elevations and gentle slopes. Less consideration were assigned to rainfall and LST for the reasons explained earlier and this also reflects in the final maps. Further observations of the sites on Google earth shows that most of the sites are located at the depression very close to the foot of the hills and ground observations reveals large volumes of water flowing down this hills after rainfall (Figure 9).
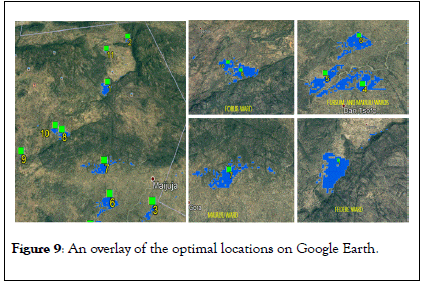
Figure 9: An overlay of the optimal locations on Google Earth.
Field validation and water demand
The last component of the validation is the field work. It was observed that some of the selected sites are currently under irrigation attributing to seasonal streams (Figure 10). Although Maijuju ward has the largest irrigation practice and our analysis reveals more potential for irrigation which can further advance small holder irrigation activities in the area. The respondents recounted that water scarcity is one of the major challenges they encounter. Usually most of the cultivated crops are harvested multiple times (tomatoes, cucumbers, pepper, Okra, peas, etc), but because the streams dry up before the onset of rain, crops wilts and dies before the subsequent harvests, leading to extensive reports of yield losses. Sadly, some of the farmers reported extreme water competition during the peak of water scarcity in March- early May. In extreme cases, farmers disconnect each other illegally, which results to unhealthy rivalry and clashes. It was also observed that some locations extensively cultivated during rainy season, are not irrigated due to the absence of streams for dry season farming. There is a huge potential for irrigation in this area if water is made available as proposed in our findings.
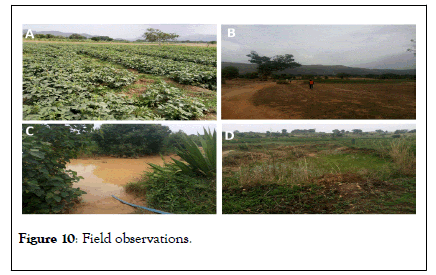
Figure 10: Field observations.
Most of the streams were dry during our field visit in April, which is the peak period of water withdrawal (Figure 11). Farmers were seen taking extreme measures, time and energy to source for water to irrigate their crops. They were digging dry rivers and to accumulate water to irrigate and sustain their crops through the dry season. The farmers confirmed their determination for irrigation farming but are impeded by water scarcity and poverty. It was observed that most farmers irrigate with motorized water pumps (2.5 hp to 5 hp) and this if not controlled leads to water wastages. Although using water pumps is physically less demanding and hastens the time used to irrigate crops, leading to increased farm sizes and improved livelihoods [20]. This can be tackled if central irrigation water pumping proposed and tested by FAO, (2014) can be adopted. It leads to reduction in petroleum requirement for water pumping and decrease the issues of farmer conflicts, as well as reduced pollution and related climate change consequences.
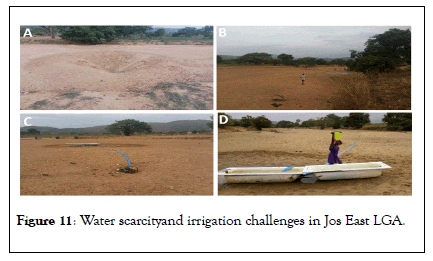
Figure 11: Water scarcityand irrigation challenges in Jos East LGA.
In general, cultivations are on a small scale and the interviewed farmers attributed it to water scarcity in the seasonal streams/ rivers and coupled with other factors like lack of funds. Most farms observed are below 1 ha and this confirms World Bank report in 2011 about irrigated farms steds being less than 1 ha in most cases, while FAO reports 1-3 ha. Impressively, all the sites are located on existing depressions and close to relatively assessable roads. Soil observations revealed that soils in some of the site are Sandy or Sandy Loam and, in most cases, appears to be porous, it may lead to low water retention capability. This was also revealed on the soil map. Therefore, intense soil surveys and tests should be carried out to assess this element before final implementations.
Conclusion
Result reveals that 11 sites are optimally suitable for siting reservoirs for small holder irrigation activities in Jos East LGA. Analysis of the water collection potential reveals that with the estimated reservoir capacity, the collected water can irrigate at the least ~10.8 to 19.4 ha, on the average ~14 to 26 ha and on the best instance ~33 to 62 ha annually. A total of 5 out of the 10 political wards are captured on the optimally suitable areas. This is influenced by lower flood plains with a range of river catchments within the selected areas. Although the 6 excluded wards were covered if the “ very suitable ” category is opted (suitability value 7). Going forward, this method is recommended for implementation in other parts of Plateau state, Nigeria, Africa with similar climatic, environmental conditions and irrigations programs. Different scenarios can be tested to select the most suitable optimal scenario which corresponds with real world programs leading to pragmatic solutions.
These reservoirs are proposed for smallholder agriculture with little engineering and fund requirements, therefore farmer groups, local and intentional private investors can partner with local farmers to sponsor such micro projects, and this has the potential to reduce poverty, increase income and agricultural productivity in Nigeria/Africa. Field observations revealed that soils in some of the sites are sandy and porous, this should be further evaluated by professional hydrologists, lithologist and engineers with state-of-art equipment and vigorous field measurements. Catchment analysis at different optimal sites should be carried out to analyze and estimate the potential impacts of constructing these reservoirs on downstream and major river catchments (River Kaduna). Even though the expected impact is very minimal because the reservoirs are to be constructed on small scales and earth dams are cost effective.
Conflict of Interest Statement
Authors declare no conflict of interest.
Acknowledgement
We acknowledge the support of the management of our organization and employer, National Centre for Remote Sensing Jos, which is an aegis of National Space Research Agency, Nigeria. We also acknowledge the state holders of the Jos East LGA under the leadership of Hon Dauda Barde for giving us the opportunity to present our research findings in 2018, with a promise for implementation in due time to boost sustainable irrigation practices in Jos East LGA. Lastly, we offer due acknowledgement to the Leibniz Centre for Agricultural Landscape Research (ZALF), Müncheberg, Germany and Earth Observation Lab, Geography Institute, Faculty of Mathematics and Natural Sciences, Humboldt University of Berlin where the first author is currently undergoing a collaborative research which will lead to her PhD.
REFERENCES
- Apata TG, Folayan A, Apata OM, Akinlua J. The Economic role of Nigeria’s subsistence agriculture in the transition process: Implications for rural development. Ann Conf Agri Eco Soc. 2011;13(1):101-112.
- Higgs G. Integrating multi-criteria techniques with geographical information systems in waste facility location to enhance public participation. Waste Man Res. 2006; 24:105.
- Hajkowicz S, Collins K. A review of multiple criteria analysis for water resource planning and management. Water Res Man. 2007;21(9):1553-1566.
- Iftikhar S, Hassan Z, Shabbir R. Site suitability analysis for small multipurpose dams using geospatial technologies. J Rem Sens & GIS. 2016;5:162.
- Baban SMJ, Flannagan J. Developing and implementing GIS assisted constraints criteria for planning landfill sites in the UK. Plan Pract Res. 1998;13(2):139-151.
- Babalola A, Busu I. Selection of landfill sites for solid waste treatment in Damaturu Town-Using GIS Techniques. Water Res Man. 2010;41:220-223.
- Al-Hanbali A, Alsaaideh B, Kondoh A. Using GIS-based weighted linear combination analysis and remote sensing techniques to select optimum solid waste disposal sites within Mafraq City. J Geogr Inf Sys 2011;3(2):267-278.
- Begic F, Afgan N. Sustainability assessment tool for the decision making in selection of energy system-Bosnian case. Energy. 2007;32:1979-1985.
- Kaya T, Kahraman C. Multi-Criteria renewable energy planning using an integrated fuzzy VIKOR & AHP methodology: The case of Istanbul. Energy. 2010;35:2517-2527.
- Charabi Y, Gastli A. PV site suitability analysis using GIS-based spatial fuzzy multi-criteria evaluation. Ren Energ. 2011;36(9):2554-2561.
- Kumar A, Dubey OP, Ghosh SK. GIS based irrigation water management. Int Journal of Res in Engr Tech. 2014;22(1):2321-7308.
- Alsafi HIJ. Applications of GIS software in irrigation. J Applied Sciences. 2013;21(5):1905-1916.
- Ali MH. Practices of irrigation & on-farm Water Management. Spr Sci Bus. 2011;43:7637-7636.
- Knox JW, Weatherfield EK. The Application of GIS to irrigation water resource management in England and Wales. Geog J. 1999;165(1):90-98.
- Hughes JMR, James B. A hydrological regionalization of streams in Victoria, Australia, with implications for stream ecology. Mar Freshwater Res. 1989;40:303-326.
- Richter BD, Baumgartner JV, Powell J, Braun DP. A Method for assessing hydrologic alteration within ecosystems. Conser boil. 1996;10:1163-1174.
- Anandababu D, Purushothaman BM, Suresh BS. Estimation of land surface temperature using LANDSAT 8 Data. Int. J Adv Res. 2018;4(2):177-179.
- Rahman GA,Talaat AM, Zawe C. Requirements for main crops grown under three different Agro-Ecological Zones, Zimbabwe. Middle East J Agr Res. 2016;05:14-28.
- Takeshima H, Adesugba AM, Irrigation Potential in Nigeria. Some perspectives based on factor endowments, tropical nature, and patterns in favourable areas. Development Strategy and Governance Division. IFPRI. 2014.
- Tijani MN, Obayelu AE, Sobowale A, Olatunji AS. Welfare analysis of smallholder farmers by Irrigation systems and factors affecting their production outputs in Nigeria. J SustWater Quality Ecol. 2015;21:3-4.
- Abric S, Sonou M, Augeard B, Onimus F, Durlin D, Soumaila A, et al. Lessons learned in the development of smallholder private irrigation for high-values crops in West Africa. Washington. 2011.
- Becker E, Li ZL. Towards a local spilt window method over land surface. Intern J of Rem Sens. 1990;11:369-394.
- Bulus H. Effects of climate change on Irish potatoes farming in plateau: a study of north and central zones of Plateau state, Nigeria. Int J Econs Com Mang. 2017;11:274.
- Carlson T. Triangle models and misconceptions. Int J Remote Sens App. 2013;3:155-158.
- Ceccato P, Flasse S, Tarantola S, Jacquemond S, Gregoire JM. Detecting vegetation water content using reflectance in the optical domain. Rem Sens of Env. 2001;77:22-33.
- Garcia J, Alvarado A, Blanco J, Jiménez E. Maldonado A, Cortés G. Multi-attribute evaluation and selection of sites for agricultural product warehouses based on an analytic hierarchy process. Comp Elect Agri. 2014;100:60-69.
- Jeffrey H, Bryan MW. Using GIS to estimate lake volume from limited data. J Lake Res Man. 2010;26(3):194-199.
- Kogan FN. Application of vegetation index and brightness temperature for drought detection. Adv Space Res. 1995;11:91-100.
- Tarantola S. "Labour Force Statistics, (2010)". Nigerian Bureau of Statistics. Adv Space Res. 2015;34:115-117.
- Ochir A, Boldbaatar D, Zorigt M, Tsetsgee S, Van Genderen JL. Site selection for water harvesting ponds using spatial multi-criteria analysis in a region with fluctuating climate. Adv Space Res. 2017;22:132-139.
- Sundara K, Udaya BK, Kumari P. Estimation of land surface temperature to study urban heat island effect using Landsat ETM 1 Image. Intern J Eng Sci Technol. 2012;42:771-778.
- Tilman D, Cassman KG, Matson PA, Naylor R, Polasky S. Agricultural sustainability and intensive production practices. Nature. 2002;418:671-677.
Citation: Ibrahim ES, Gajere EN, Dang BA, Jerome I, Dashan T, Mwada H, Ojih S (2020) Geospatial Tools for Suitable Assessment of Small Holder Irrigation Water, towards Increased Food Production and Poverty Eradication in Nigeria: A Case of Jos East LGA. Plateau State. J Remote Sens GIS. 9:274. DOI: 10.35248/2469-4134.20.9.274
Copyright: © 2020 Ibrahim ES, et al. This is an open-access article distributed under the terms of the Creative Commons Attribution License, which permits unrestricted use, distribution, and reproduction in any medium, provided the original author and source are credited.
