


Indexed In
- Genamics JournalSeek
- Academic Keys
- JournalTOCs
- China National Knowledge Infrastructure (CNKI)
- Access to Global Online Research in Agriculture (AGORA)
- Centre for Agriculture and Biosciences International (CABI)
- RefSeek
- Directory of Research Journal Indexing (DRJI)
- Hamdard University
- EBSCO A-Z
- OCLC- WorldCat
- Scholarsteer
- SWB online catalog
- Publons
- Euro Pub
- Google Scholar
Useful Links
Share This Page
Journal Flyer
Open Access Journals
- Agri and Aquaculture
- Biochemistry
- Bioinformatics & Systems Biology
- Business & Management
- Chemistry
- Clinical Sciences
- Engineering
- Food & Nutrition
- General Science
- Genetics & Molecular Biology
- Immunology & Microbiology
- Medical Sciences
- Neuroscience & Psychology
- Nursing & Health Care
- Pharmaceutical Sciences
Research Article - (2019) Volume 10, Issue 8
Formulation of Substantial Natural Flavors from Plant Materials for Food and Beverage Industries
Mesfin Getachew1*, Sisay Awoke2, Yadessa Melaku3, Minbale Gashu4 and Zelalem Gizachew52Department of Chemistry, College of Natural Science, Wollo University, Ethiopia
3Department of Chemistry, Adama Science and Technology University, Ethiopia
4Department of Debre-Birhan, Wollo University, Ethiopia
5Department of Chemistry, Dire-Dawa University, Ethiopia
Received: 22-May-2019 Published: 01-Jul-2019, DOI: 10.35248/2157-7110.19.10.805
Abstract
Ten plant species, Cuminum cyminum seed, Foeniculum vulgare seed, Trachyspermum ammi seed, Nigella sativa seed, Coriandrum sativum seed, Aframomum corrorima fruit, Zingiber officinale rhizome, Cinnamomum aromaticum bark, Rosemary officinalis leaf and stem, and Thymus schimperi leaf, which are traditionally used as spices in Ethiopia were hydrodistilled to isolate their volatile constituents in order to identify their character-impact odorants. These spices comprise of 4%, 5.5%, 4%, 0.8%, 0.3%, 2%, 1%, 0.5%, 1.2% and 0.7% essential oil by mass. The GC-MS analysis of these essential oils obtained from these ten species led to the identification of 64 compounds. Twenty-three formulations were developed, of which 16 were from powdered spices to flavor bread (food) while the remaining seven were obtained from essential oil for flavoring bread and local areki (beverage). The flavor characteristics of these formulated samples were investigated by using GC-MSD and descriptive sensory analysis techniques. The key aroma impact compounds in each flavor were detected and the ultimate customer sensory taste of the products was determined for all samples. Results from the organoleptic evaluations of bread samples showed that the flavors prepared by adding essential oils of Foeniculum vulgare, Cuminum cyminum, Aframomum corrorima, Nigella sativa, and Trachyspermum ammi after fermentation had highest overall acceptability. Furthermore, local areki comprising of formulas developed from oil samples obtained from Foeniculum vulgare and Coriandrum sativum had better overall acceptability.
Keywords
Flavor; Sensory evaluation; Food and beverages
Introduction
Nature endowed us a variety of valuable resources for the survival of all living organisms on earth. Plants are vital to mankind, animals and other living things and also to the environment [1]. The association of plants with humans originated with the beginning of the life of humans on earth [2]. In the long run, human learned to recognize and categorize plants suited for meeting the basic necessities of life as a food supply. Hence humans should get sufficient and nutritionally adequate quantity and quality of food [3]. As time passed, humans were able to gain control of their food sources as they developed better means of food production. Furthermore, they were also able to use herbs and spices to cover the foulness and off-flavor of foods. This then began a new era of food additives.
Food additives are the substances which are added to food either directly and intentionally for a functional purpose or indirectly during some phase of production, processing, storage or packaging without intending that it remain or serve a purpose in the final product. It does not include either the basic foodstuff itself or contaminants. The two types of food additives are intentional and incidental. Food additives are used for the purpose of maintaining or improving keeping quality, texture, consistency, appearance and other technological requirements [4]. A flavor is a sensory result of a substance and is determined from taste and smell. The source of flavor ingredients can be either natural or artificial. According to the FDA, “the term natural flavor means the essential oil, oleoresin, essence or extractive, protein hydrolysate, distillate or any product of roasting, heating or enzymolysis, which contains the flavoring constituents derived from a spice, fruit or fruit juice, vegetable or vegetable juice, edible yeast, herb, bark, bud, root, leaf or similar plant material, meat, seafood, poultry, eggs, dairy products or fermentation products thereof whose significant function in food is flavoring rather than nutritional. Hence it includes the natural essence or extractives obtained from plants. Most of the natural flavors have an additional advantage of possessing medicinal applications. They are also biodegradable, environmentally friendly and have no adverse effects on consumers. In contrast, artificial flavorings are derived from organic compounds such as esters, aldehydes, alcohols, and acids. Artificial flavors are made of many compounds that complement each other to form the targeted flavor [4-6].
Ethiopia is fortunate in having a wide range of various plants grown in different agro-climatic zones. This enables the country to cultivate various spices which are principally used for flavoring food and beverages. Additionally, their contributions as medicinal and preservatives are also significant. Despite having many indigenous spices in Ethiopia, the country is unable to fulfill its domestic demand of flavoring agents. This situation forces our country to import flavoring agents from other countries of the world. The imports of artificial flavoring agents can definitely impose a severe drain on the national economy which is one of the serious concerns of the country. Furthermore, imported flavors are synthetic with adverse health effects such as hyper-kinesis, disabilities, carcinogenicity, genotoxicity, and neurotoxicity. Therefore, more effort has to be made by different bodies to increase the production of flavoring agents for food and beverages in quantity and quality so that the drainage of foreign exchange reserves is reduced. Ethiopia is rich in aromatic plants useful as spices. Literature survey made on some spices which are traditionally used in Ethiopia along with their essential oil constituents and applications is presented below [7]. The seeds of plants mentioned in Table 1 are used as a flavor for meat dishes, bread, soups, coffee, alcoholic beverages, syrups, liqueurs, candy, chocolate, and baked foods.
| Sources of Oil (Am=Amharic) | % Oil | Major Components |
|---|---|---|
| Cuminum cyminum (Am. Kemun) | 4.5 | Cuminaldehyde (40%-65%) |
| Foeniculum vulgare (Am. Insilal) | 6 | Contains trans-anethole (50%-70%), d-fenchone (20%) |
| Trachyspermum ammi (Am. Nech azmud) | 3-10 | Carvacrol (69%), α-pinene (6%), β-pinene (0.5%), α-terpinene (10%), β-phellandrene (11%) |
| Nigella sativa (Am. Tiqur azmud) | 1 | Thymoquinone (14%) |
| Coriandrum sativum (Am. Dinblal) | 0.5 | d-linalool (76%), α-pinene (1.5%), Limolene (12.5%), Camphor (6%), Grenaniol (2.7%) |
| Aframomum corrorima (Am. Korerima) | 3.3 | 1,8-cineol (37.6%) Terpinyl acetate (11%), Nerolidol (14%) |
| Zingiber officinale (Am. Zingible) | 2.0 | Zingiberene (35%), β-bisabolene (10%), Sesquiphellandrene (12%) |
| Cinnamomum aromaticum (Am. Qirinfud) | 0.7 | Cinnamaldehyde (38%), Linalool (14%), Cinnamyl acetate (18%), β- phellandrene (10%) |
| Rosemary officinalis (Am. Yetibs enchet) | 2 | 1,8-cineole (27%), Borneol (16%), Camphor (10%) |
| Thymus schimperi (Am. Tosign) | 1 | Thymol (64%) |
Table 1: Major constituents of oil by hydro-distillation.
Formulations of flavor from aroma chemicals are used globally for imparting attractive taste and aroma to processed foods and beverages. The worldwide flavor generally earns returns in excess of the chemical industry average. The industry’s close association with the health, food and beverage markets means that its revenues are relatively stable, largely insensitive to commodity cycles and relatively recession-resistant [8]. One of the responsibilities of professionals is to alleviate the societal and governmental challenges by doing research to secure food and beverage products from industries. This may contribute to the decrement of foreign currency and substituting synthetic flavors by the natural ones. It is known that the contribution of natural aroma to the flavor quality of food product has gained increasing attention. Though our people are traditionally using many indigenous spices to flavor their foods, the research work is done to exploit the potential of these spices as a flavoring agent is limited. Furthermore, sufficient information is also lacking in an attempt made to isolate and characterize flavoring agents from Ethiopian spices. Therefore, the present study is worth to assess natural flavors from aromatic plants and develop an extraction/isolation mechanism to scale up the products which have a substantial role in replacing the imported synthetic flavors for beverage and food industries [8-11].
Flavor analysis during product development is typically performed by human organoleptic analysis by a panel of experts, the so-called Sensory analysis of flavors. The use of human panelists for odors is usually accurate, but costly and timeconsuming. Furthermore, human sensory panel assessments, which can be adversely affected by external parameters such as illness or fatigue, are usually subjective. The human sensory panel is also limited to odors that are not toxic or obnoxious [5]. The meaningful correlation of sensory data (biological activity) with analytical data is one of the most challenging tasks in flavor research. Attachment of instrumental measurements with sensory analysis techniques used to try and determine the exact volatile(s) responsible for some flavor sensations. It is possible to determine direct relationships between a sample odor and a chemical. Common ways to do this are through either comparative sensory analysis of the sample and the volatile compounds, using sensory analysis to detect aroma attributes and a GC-MS to detect the volatiles and find statistical associations [12,13].
Most food and beverage flavors are extremely complex and arise from the combination of a number of chemical components [10-15]. Since Ethiopia is becoming industrialized in food and beverage industries formulating flavor was taking as a primary objective of this study.
Materials and Methods
Plant materials, chemicals, and apparatus
At the beginning of this study, the researchers made a survey in five different directions of Ethiopia including Nekemte, Jimma, Arbaminch, Debre Birhan-Dessie, and Bahir Dar. Field visiting and collecting primary data related to the indigenous knowledge through one-on-one interviews with the community were made on plants traditionally used as spices. The research team members brought 40 plant materials which are traditionally used by the Ethiopian community either as spices or medicines. After a thorough discussion, the team agreed to analyze only 20 samples. These 20 plant materials were subsequently subjected to preliminary tests which led us to the selection of ten chemically promising and nontoxic plant materials including
• Cuminum cyminum (Am. Kemun) seed
• Foeniculum vulgare (Am. Insilal) seed
• Trachyspermum ammi (Am. Nech azmud) seed
• Nigella sativa (Am. Tiqur azmud) seed
• Coriandrum sativum (Am. Dinblal) seed
• Aframomum corrorima (Am. Korerima) fruit
• Zingiber officinale (Am. Zingible) rhizomes
• Cinnamomum aromaticum (Am. Qirinfud) bark
• Rosemary officinalis (Am. Yetibs enchet) leaf and stem
• Thymus schimperi (Am. Tosign) leaf
Organic solvents such as hexane, ethyl acetate, chloroform, and methanol, and apparatus including Clevenger, TLC, NMR, and GC-MS were used for extraction, isolation and characterization of flavor components.
Essential oil extraction and formulation
Each 100 g of each material was subjected to hydro-distillation in Clevenger apparatus for 3 hour and the essential oils were dried over anhydrous Na2SO4, yield calculated, stored in a dark glass bottle and kept at 4°C until analysis. 20 g of ground samples were extracted using ethanol to afford crude extracts and analyzed using Thin Layer Chromatography (TLC). Different purposely selected proportions of the ground materials and essential oils of the first six plant materials were mixed to form a formula (Ffb1-23) in the presence of food-grade ethanol. The first sixteen were made from ground plant materials (1 g each) whereas the next seven were composed of essential oils (100 μL each) of the respective plant's materials collected (1-6). But, the amounts of the major components may differ for food and beverage (Table 2) [10].
| Powdered plant materials | Essential oil | ||||
|---|---|---|---|---|---|
| Before fermentation | Composition | On fermented dough | Composition | On fermented dough | Composition |
| Ffb1 | 1-6 | Ffb9 | 1-6 | Ffb17 | 1-4,6 |
| Ffb2 | 1-4,6 | Ffb10 | 1-4,6 | Ffb18 | 1,6 |
| Ffb3 | 2.3 | Ffb11 | 2.3 | Ffb19 | 2,5 |
| Ffb4 | 2,5 | Ffb12 | 2,5 | Ffb20 | 3,4 |
| Ffb5 | 2,6 | Ffb13 | 2,6 | Ffb21 | 4,5 |
| Ffb6 | 3,4 | Ffb14 | 3,4 | Ffb22 | 1,5 |
| Ffb7 | 3,6 | Ffb15 | 3,6 | Ffb23 | 3,6 |
| Ffb8 | 4,6 | Ffb16 | 4,6 | ||
Table 2: Formulation.
Gas chromatography-mass spectrometry
The separation was performed on GC-MSD system (Agilent technologies 7820A) coupled to a mass detector (5977E MSD) and a column (30 m × 0.25 mm × 0.25 μm film thickness). Analytes were injected at a temperature of 250°C. Helium purified at 99.99% was selected as a carrier gas at a flow rate of 1 mL/min. The temperature program was performed at 60°C for 3 min, then increased at a rate of 5°C/min and maintained at 250°C . The mass selective detector was applied in an electron impact ionization mode at 70 ev. The identification of the constituents was based on a comparison of their retention indices relative to those of literature. Further identification was made by matching their recorded mass spectra with those stored in the mass spectral library of the GC-MSD data system.
Baking of bread and serving local areki
Powdered wheat (24 Kg) was bought from a shop (AA) and 8 pieces of bread (1 Kg each) were made by adding flavors (Ffb1-8, 1 g) before fermentation and the other 8 pieces of bread (1 Kg) were made by adding a similar amount of flavor (Ffb 9-16) before baking. The remaining seven flavors (Ffb17-23, 1 mL) each were added to the fermented dough before baking. Additional 8 bread samples were made without flavoring material as control. All sample bread were baked in one day with the same condition and by the same locally known professional women. Each slice of bread type was coded and served for eight groups of assessors at three different times. The formulas made from oil extracts (Ffb 17-23, 100 μL) were diluted in 400 μL of alcohol. Five liters of areki were bought from the local market (AA) and seven of the diluted flavors (100 μL) each were added to half liters of areki. The remaining 1.5 liters were unflavored as control. In the meanwhile, they were coded and served for seven groups of assessors differently.
Sensory and statistical analysis
It was not possible to get professional sensory panelists in Ethiopia on analysis of flavors of food and beverage. Selected and trained consumers arranged in 7/8 groups (a group of 3 assessors) performed sensory analysis at rooms arranged for each activity in triplicate. Formulated flavor samples were added to dough and areki for organoleptic assessment. Slices of bread and areki in vials were presented to the assessors for comparative aroma evaluation of flavored and the unflavored samples in a randomized order without sample information. Evaluators at three independent sessions scored the overall flavor acceptability and describe the samples on a scale from 0 (not acceptable) to 4 (most acceptable). Mean of the attributes given by the assessors were taken. One-way ANOVA was used for comparisons among flavors (Ffb1-23) in the perception of each odor attribute and for quantitative results for each odorant and taste, with significance level at 0.05.
Results and Discussion
The GC-MS analysis of essential oils
Foods and beverages are flavored for stimulating the sense of taste, mouthfeel, and odors. Essences, composed of flavor compounds, are usually used in chewing gum, gelatin desserts, ice creams, baked foods, drugs and pharmaceuticals, and soft drinks. Flavor analysis and identification of flavors are difficult tasks. Targeted flavor compounds are often present in parts per million levels, making them very difficult to extract or detect. Essential oils and extracts of aromatic plants have been recognized for many years as a great source of food additives. They have been employed for a long time in different industries, mainly in food (as flavorings and preservatives), perfumes (fragrances and aftershaves), pharmaceuticals (therapeutic action) and for centuries in traditional medicine. The aroma imparted by spices should somewhat reflect the essential oil composition of the samples. There are several techniques available to assess the essential oil constituents of spices. Many reports showed that gas chromatography (GC) is a very useful method for analyzing volatile components of foods. When combined with mass spectroscopy (MS), it is excellent for the identification of separated compounds. Combining these two techniques proves to be very useful for chemical analysis. It also allows a mixture to be analyzed qualitatively and quantitatively. Currently, the simplification of the instrument and the amount of time to analyze a sample is also improved. Present GC-MSs have a library reference already on the computer to compare and identify compounds in one’s sample. Today GC-MS is used in pharmacological, medical, environmental, forensics, and law enforcement fields.
The analyses of the essential oil obtained in this work were made using Gas Chromatography-Mass Spectrometry (GCMSD). In the course, ten essential oil samples were selected and analyzed using GC-MSD. Peak identification of the essential oils was made using the retention times observed from the chromatogram with those in the Mass Hunter/Library/ NIST14.L. Further confirmation was made from their corresponding mass fragmentation pattern observed from their mass spectrum. In some cases, the chromatograms were compared with the literature reported for the same species. The essential constituents of the analyzed spices obtained through hydro-distillation using
Clevenger apparatus comprises of Cuminum cyminum seed (4%), Foeniculum vulgare seed (5.5%,), Trachyspermum ammi seed (4%), Nigella sativa seed (0.8%), Coriandrum sativum seed (0.3%), Aframomum corrorima fruit (2%), Zingiber officinale rhizome (1%), Cinnamomum aromaticum bark (0.5%), Rosemary officinalis leaf and stem (1.2%), and Thymus schimperi leaf (0.7%) oil by mass. A total of 64 compounds were obtained using GC-MS. The oil is primarily made up of a class of compounds referred to as terpenes. Terpenes are classified by how many carbon atoms they possess, in units of five. The major compounds identified are monoterpenes and sesquiterpenes. Monoterpenes are the prototypal molecule comprising of two C5 isoprene subunits. Sesquiterpenes are created by the addition of another isoprene subunit to a terpene, creating a C15 molecule. The chemical constituents of essential oil obtained from ten different species were briefly described as follows:
Seeds of Cuminum cymium (E1): The seeds of Cuminum cymium were hydrodistilled using a Clevenger apparatus to afford 4% yellowish oil. The chemical composition found in the essential oil analyzed using GC-MS were found to contain mainly monoterpens. Among these, 83% of which are oxygenated while 9% constitute hydrocarbons. The most abundant component observed was cuminaldehyde. Table 3 shows a list of compounds considered important to the classic profile of Cuminum cymium.
| No. | tR | Constituents of the essential oil | Chemical structure | Area percent | Remark |
|---|---|---|---|---|---|
| 1 | 9.565 | ρ-cymene |  |
5.23 | |
| 2 | 10.200 | ϒ-terpenene |  |
3.62 | |
| 3 | 18.728 | Cuminaldehyde |  |
59.88 | |
| 4 | 20.571 | Safranal | 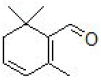 |
8.06 | |
| 5 | 20.886 | Cuminic alcohol | 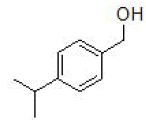 |
14.8 |
Table 3: Essential oil constituents of the oil of the seeds of Cuminum cymium (E1).
On hydro-distillation, with Clevenger apparatus, the ground seeds of Foeniculum vulgare gave 5.5% yellowish oil. The constituents of the oil were subsequently analyzed with GC-MS which furnished seven compounds all of which were turned out to be oxygenated monoter-penes. The major compound observed from the GC-MS spectrum was estragole which constitutes about 37% of the oil. This was followed by fenchone. Table 4 shows a list of compounds detected from the ground seeds of F. vulgare.
| No | tR | Constituents of the essential oil | Chemical Structure | Area percent | Remark |
|---|---|---|---|---|---|
| 1 | 9.805 | Eucalyptol | 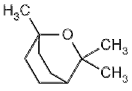 |
2.60 | |
| 2 | 12.150 | Fenchone | 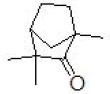 |
9.89 | |
| 3 | 14.454 | Camphor |  |
0.77 | |
| 4 | 20.879 | Estragole | 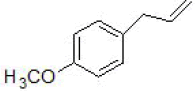 |
37.02 | |
| 5 | 20.99 | Thymol | 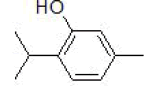 |
1.78 | |
| 6 | 23.827 | Eugenol | 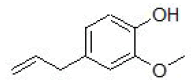 |
6.77 | |
| 7 | 26.354 | Caryophyllene | 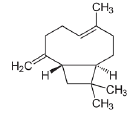 |
1.27 |
Table 4: Essential oil constituents of the oil of the seeds of Foeniculum vulgare (E17).
Trachyspermum ammi seeds, E3: The yellowish oil (4%) obtained on hydro-distillation with Clevenger apparatus of the ground seeds of Trachyspermum ammi were analyzed using GCMS which afford one oxygenated and three non-oxygenated monoterpenes. Among these, 70% were found to be oxygenated monoterpenes while the remaining are hydrocarbons. Thymol, which is an antioxidant compound reported in the literature, constitutes about 70% of the essential oil. The presence of this compound to such a high level adds one positive attribute of this spice as an additive. Table 5 depicts a list of compounds from the ground seeds of Trachyspermum ammi.
| No. | tR | Constituents of the essential oil | Chemical Structure | Area percent | Remark |
|---|---|---|---|---|---|
| 1 | 7.860 | β-pinene |  |
3.03 | |
| 2 | 9.572 | β-cymine | 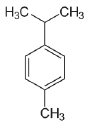 |
10.22 | |
| 3 | 10.928 | ϒ-terpenene | 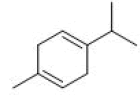 |
16.39 | |
| 4 | 21.189 | Thymol | 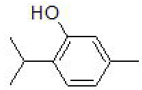 |
70.33 |
Table 5: List of compounds obtained from the seeds of Trachyspermum mami.
Nigella sativa, E7: The seed of Nigella sativa is among few medicinal plants containing both fixed and essential oil. Hydro-distillation of the seeds afford 0.8% yellowish oil, which was subsequently subjected to GC-MS. Results showed that the oil comprises of five monoterpenes. The major compound was found to be thymoquinone. This compound was reported to have immense biological activities including antioxidant, anti-inflammatory, anticancer and etc. The presence of this compound in a remarkable amount in the seeds of this plant adds one positive aspect of the seeds of N. sativa. Table 6 indicates a list of compounds from the ground seeds of N. sativa .
| No. | tR | Constituents of the essential oil | Chemical Structure | Area percent | Remark | |||
|---|---|---|---|---|---|---|---|---|
| 1 | 7.858 | β-pinene |  |
2.93 | ||||
| 2 | 9.812 | Eucalyptol | 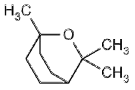 |
3.86 | ||||
| 3 | 15.915 | Terpinen-4-ol | 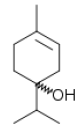 |
10.88 | ||||
| 4 | 19.132 | Thymoquinone | 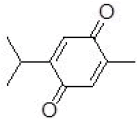 |
14.70 | ||||
| 5 | 25.732 | Longifolene | 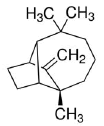 |
3.93 | ||||
Table 6: Compounds from the seeds of N. sativa.
Coriandrum sativum seeds, E2: σ-Pinene, D-limonene, ϒ-terpenene, d-linalool, camphor, estragole, thymol and geranyl acetate were the major compounds identified from the essential oil (0.3%) of the seeds of Coriandrum sativum. The predominant compound was found to be d-linalool which constitute to about 67% of the essential oil. The whole result showing a list of compounds, structures, and their corresponding area percent were depicted in Table 7.
| No. | tR | Constituents of the essential oil | Chemical structure | Area percent | Remark | |
|---|---|---|---|---|---|---|
| 1 | 6.500 | σ-pinene |  |
1.99 | ||
| 2 | 9.568 | D-limonene |  |
8.97 | ||
| 3 | 10.905 | ϒ-terpenene |  |
6.01 | ||
| 4 | 12.745 | d-linalool |  |
67.17 | ||
| 5 | 14.471 | Camphor |  |
7.97 | ||
| 6 | 16.844 | Estragole |  |
2.23 | ||
| 7 | 20.977 | Thymol | 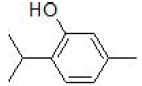 |
3.54 | ||
| 8 | 28.971 | Geranyl acetate | 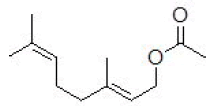 |
2.11 | ||
Table 7: List of compounds identified from the seeds of Coriandrum sativum.
Aframomum corrorima, E10: The 2% yellowish oil obtained on hydro-distillation of the fruit of Aframomum corrorima using Clevenger apparatus was analyzed using GC-MS. It was found that the oil is rich in oxygenated hydrocarbons which level to about 58% of the essential oil. The major constituent was identified as eucalyptol followed by geraniol. Lists of compounds identified from the essential oil of the fruit of Aframomum corrorima were shown in Table 8.
| No | tR | Constituents of the essential oil | Chemical structure | Area percent | Remark |
|---|---|---|---|---|---|
| 1 | 7.855 | β-pinene |  |
10.34 | |
| 2 | 9.562 | o-Cyamine |  |
2.56 | |
| 3 | 9.838 | Eucalyptol | 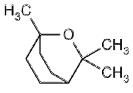 |
29.23 | major |
| 4 | 16.507 | σ-terpineol |  |
2.47 | |
| 5 | 16.841 | σ-Terpineol |  |
7.64 | |
| 6 | 19.359 | Geraniol | 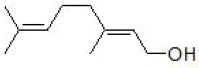 |
10.13 | |
| 7 | 26.354 | caryophyllene |  |
4.06 | |
| 8 | 32.189 | Nerolidol | 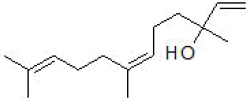 |
8.13 |
Table 8: Chemical constituent of the essential oil of the fruit of Aframomum corrorima.
Zingiber officinale, E5: On hydro-distillation using Clevenger apparatus, the rhizomes of Zingiber officinale afford 1% yellowish oil. The GC-MS analysis of the essential oil of Zingiber officinale roots showed the presence of twelve compounds all of which are monoterpenes. The major compound was identified 16 as σ- bisabolene which constitutes 10% of the essential oil. The constituent of the essential oil of rhizomes of Zingiber officinale was depicted in Table 9.
| No | tR | Constituents of the essential oil | Chemical structure | Area percent | Remark |
|---|---|---|---|---|---|
| 1 | 6.954 | Camphene |  |
0.38 | |
| 2 | 9.559 | o-Cymene | 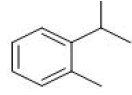 |
0.65 | |
| 3 | 9.806 | Eucalyptol | 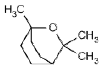 |
0.53 | |
| 4 | 10.99 | ϒ-terpenene | 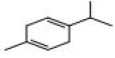 |
0.78 | |
| 5 | 12.582 | Linalool | 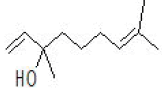 |
0.49 | |
| 6 | 15.401 | Boreneol | 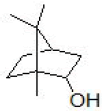 |
1.46 | |
| 7 | 16.872 | Estragole | 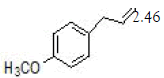 |
2.46 | |
| 8 | 23.762 | Eugenol | 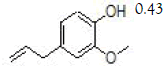 |
0.43 | |
| 9 | 28.892 | Germacrene D |  |
0.72 | |
| 10 | 29.578 | Copaene | 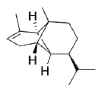 |
6.90 | |
| 11 | 30.107 | β-bisabolene | 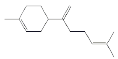 |
5.89 | |
| 12 | 30.746 | σ-bisabolene | 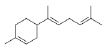 |
9.81 |
Table 9: Chemical constituent of the essential oil of the rhizomes of Zingiber officinale.
Cinnamomum aromaticum, E6: The yield of the essential oil from the bark of Cinnamomum aromaticum was 0.5%. This was subsequently analyzed with GC-MS. The results of the GC-MS analysis revealed the presence of oxygenated monoterpenes. The essential oil also comprises of a small percentage of sesquiterpenes. 2 Propenal, 3-phenyl-4-pyridine carboxy aldehyde, oxime pyridine-4-carboxamide was found to be the major abundant compound from the oil of Cinnamomum aromatic. The chemical compositions of the essential oil of the bark of Cinnamomum aromaticum were shown in Table 10.
| No | tR | Constituents of the essential oil | Chemical structure | Area % | Remark |
|---|---|---|---|---|---|
| 1 | 9.810 | Eucalyptol | 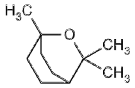 |
1.55 | |
| 2 | 12.091 | Fenchone |  |
0.78 | |
| 3 | 16.910 | Estragole | 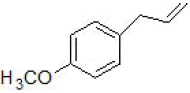 |
5.17 | |
| 4 | 18.854 | D-carvone | 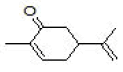 |
1.06 | |
| 5 | 20.707 | Anethole | 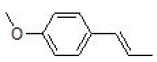 |
3.20 | |
| 6 | 24.263 | 2-propenal,3-phenyl-4-pyridinecarboxyaldehyde,oxime pyridine-4-carboximide | 50.06 | ||
| 7 | 26.546 | Naphthalene,1,2,3,4-tetrahydro-1,6-dime | 18.59 | ||
| 8 | 27.810 | Humulene | 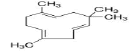 |
2.75 | |
| 9 | 30.926 | Eugenol | 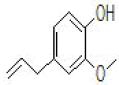 |
7.75 | |
| 10 | 32.906 | Caryophyllene oxide | 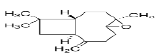 |
0.98 |
Table 10: Chemical composition of the essential oil of the bark of Cinnamomum aromaticum.
Thymus schimperi, E14: The leaves of Thymus schimperi is traditionally used in Ethiopia as a flavoring agent. On hydrodistillation, it gave 0.7% volatile oil. The chemical constituents were determined using GC-MS which showed the presence of oxygenated monoterpenes. It comprises of the monoterpene thymol (64%) in remarkable amounts which are in agreement with previous literature report [14]. Table 11 shows the constituents of the essence of the leaves of T. schimperi.
| No | tR | Constituents of the essential oil | Chemical structure | Area percent | Remark |
|---|---|---|---|---|---|
| 1. | 8.321 | β-pinene | 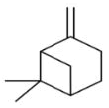 |
0.81 | |
| 2. | 9.583 | o-Cyamine | 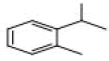 |
8.10 | |
| 3. | 12.613 | Linalool |  |
5.81 | |
| 4. | 15.911 | Terpinen-4-ol |  |
1.17 | |
| 5. | 21.718 | Thymol | 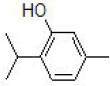 |
64.23 | major |
Table 11: Chemical composition of the essential oil of T. schimperi.
Analysis of the formulated samples
It is observed that all the ten essential oils obtained from the ten spices were analyzed and found to have various compounds which are essential as flavoring agents. The major components of the oils have their own impact in flavoring the food/beverage material. The GC-MSD data of the formulated samples revealed the presence of marker compounds present in the individual components in the formula. This likely shows that the major compounds present in the plant material are responsible for the natural aroma of the plant and also contributes to conveying flavor for foods and beverages [15,16].
Characterization of formulas using sensory test
Flavor analysis during product development is typically performed by human organoleptic analysis by a group of the panel. The use of human panelists for odors though timeconsuming is usually accurate. Based on practical preferences and time, six of the plant materials were selected for developing 23 formulas. The first 16 were developed using powdered plant materials so as to flavor bread (food) and the last 7 were developed using essential oils for flavoring both bread and local areki (beverage). Of 16 formulas, 8 (1-8) of them were added to the flour before fermentation and the remaining 8 (9-16) were mixed to the fermented dough before baking. Seven (17-23) of the formulas were oils added to the fermented dough before baking. Similarly, seven (17-23) formulas were used to flavor local areki. The assessment was done by studying the characteristics like appearance/color, flavor, texture/mouthfeel, palatability and overall acceptability of formulas in the application. The overall result of sensory analysis of flavors in bread and areki were compiled in Tables 12 and 13.
| Sample code | Color | Flavor | Palatability | Consistency | Acceptability |
|---|---|---|---|---|---|
| Ffb1 | 1 ± 0.6 | 1 ± 0.2 | 0 | 0 | 0 |
| Ffb2 | 1 ± 0.3 | 1.5 ± 0.3 | 0 | 0 | 1 ± 0.2 |
| Ffb3 | 1 ± 0.2 | 3 ± 0.9 | 2 ± 0.5 | 0 | 2 ± 0.1 |
| Ffb4 | 1 ± 0.4 | 3 ± 0.8 | 2 ± 0.4 | 0 | 2 ± 0.6 |
| Ffb5 | 1 ± 0.8 | 2 ± 0.9 | 2 ± 0.2 | 0 | 0 |
| Ffb6 | 1 ± 0.6 | 3.3 ± 0.5 | 2 ± 0.1 | 1 ± 0.4 | 2 ± 0.7 |
| Ffb7 | 1 ±0.2 | 3 ± 0.3 | 2 ± 0.3 | 0 | 0 |
| Ffb8 | 1 ± 0.1 | 2.7 ± 0.4 | 0 | 0 | 0 |
| Ffb9 | 1 ± 0.8 | 3 ± 0.1 | 2 ± 0.2 | 3 ± 0.6 | 2.5 ± 0.5 |
| Ffb10 | 1 ± 0.3 | 1.7 ± 0.1 | 0 | 0 | 1 ± 0.4 |
| Ffb11 | 1 ± 0.2 | 2 ± 0.3 | 0 | 0 | 1 ± 0.5 |
| Ffb12 | 1 ± 0.4 | 3.5 ± 0.1 | 3 ± 0.1 | 3.5 ± 0.6 | 3.5 ± 0.2 |
| Ffb13 | 1 ± 0.3 | 2.7 ± 0.9 | 0 | 0 | 0 |
| Ffb14 | 1 ± 0.1 | 3.2 ± 0.3 | 2 ± 0.6 | 3 ± 0.5 | 2 ± 0.4 |
| Ffb15 | 1 ± 0.4 | 3.5 ± 0.2 | 3 ± 0.7 | 3.5 ± 0.5 | 3.5 ± 0.2 |
| Ffb16 | 1 ± 0.2 | 1.3 ± 0.6 | 0 | 0 | 0 |
| Ffb17 | 3 ± 0.1 | 4 ± 0.8 | 4 ± 0.3 | 3.5 ± 0.4 | 4 ± 0.5 |
| Ffb18 | 3.5 ± 0.7 | 3.5 ± 0.8 | 3 ± 0.4 | 3.5 ± 0.3 | 3.5 ± 0.5 |
| Ffb19 | 3.5 ± 0.3 | 2.7 ± 0.9 | 1 ± 0.4 | 1 ± 0.1 | 1 ± 0.1 |
| Ffb20 | 3.5 ± 0.2 | 3.3 ± 0.5 | 2 ± 0.1 | 3 ± 0.1 | 2.5 ± 0.8 |
| Ffb21 | 3.5 ± 0.6 | 2.7 ± 0.3 | 0 | 0 | 1 ± 0.7 |
| Ffb22 | 3.5 ± 0.7 | 3 ± 0.4 | 2 ± 0.3 | 3 ± 0.4 | 3 ± 0.7 |
| Ffb23 | 3.5 ± 0.2 | 3 ± 0.1 | 2 ± 0.1 | 3 ± 0.3 | 2 ± 0.6 |
Table 12: Average (Mean ± RSD) sensory scores of bread samples.
| Sample code | Color | Flavor | Palatability | Consistency | Acceptability |
|---|---|---|---|---|---|
| Ffb17 | 3.0 ± 0.3 | 2.0 ± 0.7 | 2.0 ± 0.9 | 2.0 ± 0.1 | 1.0 ± 0.2 |
| Ffb18 | 3.0 ± 0.5 | 2.0 ± 0.6 | 2.0 ± 0.7 | 1.0 ± 0.2 | 2.0 ± 0.1 |
| Ffb19 | 3.0 ± 0.2 | 3.0 ± 0.4 | 3.5 ± 0.2 | 3.0 ± 0.7 | 4.0 ± 0.4 |
| Ffb20 | 3.0 ± 0.6 | 2.0 ± 1 | 1.0 ± 0.3 | 2.0 ± 0.2 | 2.0 ± 0.1 |
| Ffb21 | 3.0 ± 0.5 | 3.0 ± 0.2 | 3.0 ± 0.1 | 2.0 ± 0.4 | 2.0 ± 0.7 |
| Ffb22 | 3.0 ± 0.1 | 3.0 ± 0.3 | 3.0 ± 0.5 | 3.0 ± 0.3 | 3.0 ± 0.6 |
| Ffb23 | 3.0 ± 0.1 | 2.0 ± 0.1 | 1.0 ± 0.8 | 2.0 ± 0.8 | 1.0 ± 0.6 |
Table 13: Average (Mean ± RSD) sensory scores of areki samples.
Flavor/aroma is the main criterion that makes the product to be acceptable or unacceptable. In this study, there was a significant difference in terms of flavor of the samples analyzed. Sample Ffb17 had the highest mean score of 4 while the least value was recorded in samples Ffb 1,2,10,16 with the value of less than 2. This indicated that Ffb17 was acceptable as a flavoring agent for bread. And Ffb19 was better accepted to flavor local areki.
Food flavor arises from the interaction of taste and aroma, which imparts a pleasing and displeasing sensory experience to a consumer. It is the flavor of food that ultimately determines its acceptance or rejection, even though its appearance induces the initial response.
Chemical analysis of flavor compounds provides little insight into the actual flavor quality. Hence due attention was given to the sensory evaluation of the prepared flavoring agents. The organoleptic evaluations of bread samples showed that the flavors prepared by mixing essential oils isolated from Foeniculum vulgare, Cuminum cyminum, Aframomum corrorima, Nigella sativa and Trachyspermum ammi (specially Ffb17) added after fermentation had highest overall acceptability whereas a formula developed from oil samples extracted from ensilal and dinbilal (Ffb19) had better overall acceptability while using it in local areki.
Conclusion
Based on the sensory analysis of bread which was baked in the presence of Foeniculum vulgare, Cuminum cyminum, Aframomum corrorima, Nigella sativa and Trachyspermum ammi was preferable. And areki supplemented with oils from Foeniculum vulgare and Coriandrum sativum was preferred by consumers. The traditional sensory evaluation method has limited power to correlate with analytical rating results. Therefore, additional analysis (physicochemical analysis and an organoleptic test involving professional sensory assessors) of the formulas are necessary after that the preferred formulas can be marketed.
Acknowledgment
Ethiopian Science and Technology Minster should be acknowledged for financing this study
REFERENCES
- Mahmood KT, Mugal T, Haq IU. Moringa oleifera: A natural gift. J Pharm Sci Res. 2010;2(11):775-781
- Mamedov N. Medicinal plants studies: History, challenges and prospective. Med Aromat Plants. 2012;1:8.
- Yakubu N, Amuzat AO, Hamza RU. Effect of processing methods on the nutritional contents of bitter leaf (Vernonia amygdalina). Am J Food Nutr. 2012;2(1):26-30.
- Deibler KD, Jeannine Delwiche. Handbook of flavor characterization: Sensory analysis, chemistry and physiology. Food Sci Technol. 2003:520.
- Wijk RA, Zijlstra SM. Differential effects of exposure to ambient vanilla and citrus aromas on mood, arousal and food choice. Flavor. 2012;1:24.
- Prescott J. Flavors: the pleasure principle. Flavor. 2015;4:15.
- Nigist A, Sebsebe D. Aromatic and medicinal plants of Ethiopia. 2009.
- Zhu L, Seburg RA, Tsai E, Puech S, Mifsud J. Flavor analysis in a pharmaceutical oral solution formulation using an electronic-nose. J Pharm Biomed Anal. 2004;34:453-461.
- Longo MA, Sanroman MA. Production of food aroma compounds. Food Biotechnol. 2006;44:335-353.
- Srivastava SB. Perfume, flavor and essential oil industries. 42nd Publication on Small Scale Industries, 5th Edition, p: 94.
- Thiel L, Hendricks F. Study into the establishment of an aroma and fragrance fine chemicals value chain in South Africa, Triumph Venture Capital (Pty) Limited. 2004;1-40.
- Chambers IV, Koppel EK. Associations of volatile compounds with sensory aroma and flavor: The complex nature of flavor. Molecules. 2013;18:4887-4905.
- Ni H, Hong P, Feng H. Comparative analyses of aromas of fresh, naringinase-treated and resin-absorbed juices of pummelo by GC-MS and sensory evaluation. Flavor Fragr J. 2015; 30:245-253.
- Dagne E, Hailu S, Bisrat D, Worku T. Constituents of the essential oil of Thymus schimperi. Bull Chem Soc Ethip. 1998;12(1):79.
- Burdock GA. Fenaroli’s hand book of Flavor Ingredients. CRC press, 6th ed. 2010:2159.
- Hui YH. Handbook of food products manufacturing: Principles, bakery, beverages, cereals, cheese, confectionary, fats, fruits, and functional foods. Wiley. 2007:2237.
Citation: Getachew M, Awoke S, Melaku Y, Gashu M, Gizachew Z (2019) Formulation of Substantial Natural Flavors from Plant Materials for Food and Beverage Industries. J Food Process Technol 10:805. doi: 10.35248/2157-7110.19.10.805
Copyright: © 2019 Getachew M, et al. This is an open-access article distributed under the terms of the Creative Commons Attribution License, which permits unrestricted use, distribution, and reproduction in any medium, provided the original author and source are credited.