PMC/PubMed Indexed Articles
Indexed In
- Open J Gate
- Genamics JournalSeek
- Academic Keys
- JournalTOCs
- CiteFactor
- Ulrich's Periodicals Directory
- Access to Global Online Research in Agriculture (AGORA)
- Electronic Journals Library
- Centre for Agriculture and Biosciences International (CABI)
- RefSeek
- Directory of Research Journal Indexing (DRJI)
- Hamdard University
- EBSCO A-Z
- OCLC- WorldCat
- Scholarsteer
- SWB online catalog
- Virtual Library of Biology (vifabio)
- Publons
- Geneva Foundation for Medical Education and Research
- Euro Pub
- Google Scholar
Useful Links
Share This Page
Journal Flyer
Open Access Journals
- Agri and Aquaculture
- Biochemistry
- Bioinformatics & Systems Biology
- Business & Management
- Chemistry
- Clinical Sciences
- Engineering
- Food & Nutrition
- General Science
- Genetics & Molecular Biology
- Immunology & Microbiology
- Medical Sciences
- Neuroscience & Psychology
- Nursing & Health Care
- Pharmaceutical Sciences
Research Article - (2020) Volume 11, Issue 11
Field Experiment to Evaluate the Response of Different Varieties of Wheat against Spot Blotch (Bipolaris sorokiniana) at Bhairahawa, Nepal
Anita Paneru*, Bijaya Gahatraj, Mandeep Poudel, Pratima Subedi, GC Sovana and Rajan PaudelReceived: 02-Oct-2020 Published: 13-Nov-2020, DOI: 10.35248/2157-7471.20.11.525
Abstract
Spot blotch incited by Bipolaris sorokiniana is one of the most important foliar disease limiting wheat production in Nepal. A field experiment was conducted from 13 December 2017 to 12 April 2018 in the research field of National Wheat Research Program (NWRP), Padsari-1 Rupandehi, Nepal to evaluate response of 12 wheat varieties against spot blotch caused by Bipolaris sorokiniana. The experiment was laid out in Randomized complete block design (RCBD) with 12 treatments and three replications. Individual treatment plot was 2 m2 and total research field area was 152.5 m2. Disease scoring was done by double digit scoring starting from heading stage in which 4 scorings were done at 7 days interval following Zadok scale. Different traits taken for scoring were lesion size, lesion mimic, leaf tip necrosis, spike length, peduncle extrusion at different growth stages. Days to heading, days to maturity, 50 spike yield, and plot yield and test weight were recorded. The mean AUDPC was calculated and analyzed. Varieties differed significantly in mean AUDPC values. On the basis of mean AUDPC value, the varieties were categorized under four categories i.e., resistant, moderately resistant, susceptible and highly susceptible. Furthermore, the correlation of 12 varieties with AUDPC and various traits was analyzed. There was negative correlation between AUDPC and yield i.e. -0.62050. Among 12 varieties, RR-21 showed highest level of disease increment with AUDPC value 974.897 and found to be the most susceptible while least was observed in Danphe with AUDPC value 383.7 and found to be resistant. Badhganga with the AUDPC value of 396.517 was also found to be resistant to spot blotch. No varieties were found highly resistant. Similarly, Swargadwari, Gautam, NL 971, Tilottama, Aditya, Dhaulagiri and Vijaya appeared moderately resistant to spot blotch of wheat. Bhrikuti and WK 1204 were susceptible to spot blotch. Wheat grain yield varied among the varieties. Maximum yield was recorded in Danphe (5.7 t/ha) and minimum yield was recorded in RR-21 (3.5 t/ha). Similarly, highest value of test weight was recorded in Danphe (53.43 gm) and the lowest value was in Bhrikuti (34.53 gm). So, Danphe showing better performance at Bhairahawa can be taken as the source of tolerance in upcoming experiments and RR-21 can be used as susceptible check and these varieties can be suggested to incorporate into breeding program.
Keywords
Bipolaris sorokiniana; Wheat; Randomized complete block design
Introduction
Wheat (Triticum aestivum L.) is an annual crop belonging to the family Poaceae (Graminae) and the tribe Triticeae [1]. It has been described as the ‘King of cereals’ because of the acreage it occupies, high productivity and the prominent position it holds in the international food grain trade. It is one of the most important and the second largest cereal of the world in terms of production (729,012,175 tons), maize (Zea mays) being the first with the production of 1,037,791,518 tons and rice (Oryza sativa) being third with the production of 739.53 million tons. The production of wheat was 754.1 million tons in 2016 and 741,477,711 tons in 2014 [2]. Wheat has wide adaptability. Wheat is a winter crop however it can be cultivated in tropical, sub-tropical as well as temperate regions. It is cultivated from sea level to as high as 3300 meters. In Nepal, it is sown in October-November and harvested in March-April.
Rupandehi is a major wheat producing district of Nepal and occupies 29,400 ha under wheat with a production of 79,380 Mt and productivity 2700 kg/ha (Table 1).
Table 1: Area, production and productivity of wheat in Nepal.
| Year | Area (ha) | Production (Mt) | Productivity(Mt/ha) |
|---|---|---|---|
| 2011/12 | 765,317 | 1,846,142 | 2,412 |
| 2012/13 | 759,843 | 1,882,220 | 2,477 |
| 2013/14 | 754,474 | 1,883,147 | 2,496 |
| 2014/15 | 762,373 | 1,975,625 | 2,591 |
| 2015/16 | 745,823 | 1,736,849 | 2,329 |
Source: (Statistical Information on Nepalese Agriculture, 2015/16).
The demand for wheat is getting higher with the increase in world’s population. To meet the increasing demand to feed the world, there is limited possibility of expanding the area under wheat cultivation. The gap of demand and supply can be reduced with proper provision for crop protection along with high yielding varieties.
There are several constraints to gain the maximum yield; abiotic and biotic constraints. Among the biotic constraints spot blotch is of major importance in context of Nepal. Spot blotch incited by fungal pathogen Bipolaris sorokiniana (anamorph) and Cochliobolus sativus (teleomorph) is one of the most important foliar disease of wheat limiting the wheat production in Southeast Asia. Lesions are characterized by small, dark brown spots 1 to 2 mm long without chlorotic margin in beginning which enlarge a few centimeters and finally coalesce to form brown, irregular stripes. Disease appear as spots on seedling, plant crowns, stems, leaves, floral parts and kernels [3-8].
Symptoms caused by C. sativus were first observed in seedling stage. Yield loss varies from 15.5-19.6% to 20-80%. Research conducted on-station in NARC; Bhairahawa, Nepal showed losses of 24% to 27% in highly susceptible varieties and on-farm studies indicated up to 16% loss [7].
Spot blotch can be managed by improving soil fertility, crop rotation, residue management, chemical control and use of breeding resistant cultivars. The best, long term and environmentally safe method for sustainable disease control is the use of resistant varieties. Identification of resistant varieties on a continuous basis would be the best alternative to manage spot blotch.
In this study, an attempt has been made to characterize 12 varieties of wheat against spot blotch at NWRP, Bhairahawa.
Our study has following four objectives:
• To determine the prevalence of spot blotch of wheat.
• To estimate disease severity and intensity on different wheat varieties.
• To determine the effect of seed borne Bipolaris sorokiniana on yield.
• To find the most resistant varieties among 12 varieties.
Materials and Methods
Site: National Wheat Research Program (NWRP), Padsari-1, Rupandehi, Nepal.
Disease: Spot blotch
Varieties: 12 (Bhrikuti, Gautam, Aditya, NL 971, Vijaya, Tilottama, Danphe, Badhganga, Swargadwari, WK 1204, Dhaulagiri and RR 21).
Experimental design
The experiment was conducted in Randomized Complete Block Design (RCBD) with 12 treatments and 3 replications. Individual plot was 2 m2 (2m × 1m) with row to row spacing of 25 cm and plant to plant spacing of 5 cm. The total area of the field was 152.5 m2 (30.5m × 5m). The spacing between two replication was 50 cm and treatment spacing of 50 cm with the field margin 50 cm in all sides. The total length of the experimental design was 30.5 m and breadth of 5 m.
Twelve different varieties of wheat namely Bhrikuti, Gautam, Aditya, NL 971, Vijaya, Tilottama, Danphe, Badhganga, Swargadwari, WK 1204, Dhaulagiri and RR 21 were collected from NWRP. Land was thoroughly ploughed and leveled. Sowing of the seed was done on 13 December 2017. The scheduling of irrigation to wheat is based on physiological growth stages which are critical in demand of water. Regular field visit and rogueing of off-type cultivar was done. Disease scoring was done by randomly selecting 10 plants, which were tagged in each plot. Plants were assessed and evaluated against spot blotch disease under artificial condition. Disease scoring was done after first appearance of the spot blotch disease symptom at an interval of about 7 days. Double digit scoring was taken to calculate the area under the disease progress curve (AUDPC) value.
Agronomic attributes such as vegetative stages, leaf area (LA), plant height (PH), spike length (SL), peduncle extrusion (PE), leaf tip necrosis (LTN), lesion size (LS), lesion mimic (LM), etc. and yield attributes such as 50 ear yield (EY), plot yield (PY) and thousand kernel weight (TKW) were observed. Data entry and processing was carried out using MS-Excel version 2013. The raw data were processed to fit into SAS 9.4 version software for analysis [9-15] (Table 2).
Table 2: ANOVA table.
| Sources | df | AUDPC | LS | LTN | LM | SL | PE | PH | LA | EY | TKW | PY | DH | DM |
|---|---|---|---|---|---|---|---|---|---|---|---|---|---|---|
| Genotype | 11 | 82573.152 | 1.4 | 2.36 | 77.46 | 9.93 | 52.62 | 114.59 | 135.83 | 280.577 | 128.48 | 41225.9 | 28.1 | 1.82 |
| Replication | 2 | 3047.175 | 0.083 | 1.583 | 6.25 | 0.089 | 0.024 | 9.71 | 0.913 | 23.42 | 6.148 | 11229.2 | 0.3 | 1 |
| SEM (±) | 22 | 2857.25 | 0.053 | 0.22 | 9.28 | 1.28 | 0.998 | 6.5 | 5.3 | 43.4 | 8.762 | 6569.5 | 0.54 | 0.21 |
| CV (%) | 35 | 9.254 | 8.374 | 20.087 | 22.15 | 6.758 | 5.1 | 2.725 | 5.45 | 7.377 | 6.782 | 8.718 | 0.95 | 0.43 |
Results and Discussion
Area under Disease Progressive Curve (AUDPC)
Area under disease progressive curve (AUDPC) was calculated based on disease intensity recorded 1st on heading stage, 2nd on an thesis stage, 3rd on milk stage and 4th on dough stage. The treatments vary significantly in AUDPC values. Among the different varieties under study, Danphe was found to be the variety with lowest AUDPC value 383.7 followed by Badhganga with value 396.517 and RR-21 was found to be the variety with highest AUDPC value 974.897 followed by WK-1204 with AUDPC value 789.8 (Figure 1).
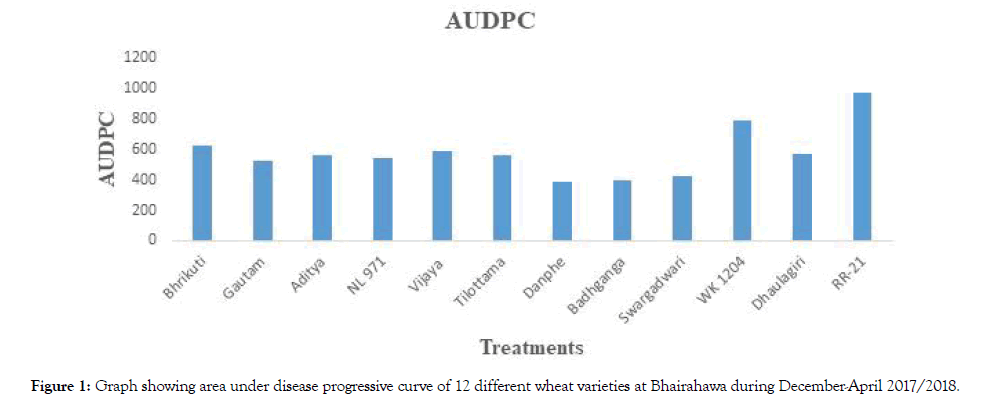
Figure 1: Graph showing area under disease progressive curve of 12 different wheat varieties at Bhairahawa during December-April 2017/2018.
Some other agronomic attributes such as leaf area (LA), plant height (PH), spike length (SL), peduncle extrusion (PE), leaf tip necrosis (LTN), lesion size (LS), lesion mimic (LM), etc. and yield attributes such as 50 ear yield (EY), plot yield (PY) and thousand kernel weight (TKW) were observed and data were noted and graphs against varieties were made.
Based on mean AUDPC values on leaves of different varieties of wheat, a scale of mean AUDPC values was proposed to categorize the varieties into 5 levels as shown below (Tables 3, 4 and 5).
Table 3: Resistant category for 12 different varieties of wheat based on mean AUDPC value.
| Mean AUDPC Values | Resistant Category | Varieties |
|---|---|---|
| 0-200 | Highly resistant (HR) | - |
| 201-400 | Resistant (R) | Danphe and Badhganga |
| 401-600 | Moderately resistant (MR) | Swargadwari, Gautam, NL 971, Tilottama, Aditya, Dhaulagiri, Vijaya |
| 601-800 | Susceptible (S) | Bhrikuti and WK 1204 |
| 801-1000 | Highly susceptible (HS) | RR 21 |
Table 4: Mean value table.
| Varieties | AUDPC | LS | LTN | LM | SL | PE | PH | LA | EY | TKW | PY | DH | DM |
|---|---|---|---|---|---|---|---|---|---|---|---|---|---|
| Bhrikuti | 627.983 | 3 | 1.33 | 18.33 | 14.73 | 16.26 | 90.767 | 46.41 | 75.12 | 34.53 | 4.24 | 78 | 114.33 |
| Gautam | 522.84 | 2 | 3 | 6.67 | 19.52 | 21.1 | 96.8 | 47.65 | 94.33 | 46.6 | 5.33 | 77 | 112.67 |
| Aditya | 563.17 | 2 | 2.67 | 16.67 | 16.93 | 19.97 | 99.43 | 42.54 | 84.67 | 41.81 | 4.475 | 76.3 | 113.67 |
| NL 971 | 545.87 | 2 | 1.33 | 18.67 | 16.53 | 21.3 | 105.1 | 40.82 | 100.7 | 44.54 | 4.77 | 79 | 114.33 |
| Vijaya | 591.976 | 3 | 1.67 | 18.3 | 14.13 | 18.73 | 98.27 | 40.42 | 85.52 | 37.23 | 3.745 | 73 | 112.67 |
| Tilottama | 561.73 | 2 | 2.33 | 11.67 | 16.36 | 21.07 | 92.96 | 38.44 | 87.66 | 46.23 | 4.787 | 77 | 114.67 |
| Danphe | 383.7 | 2 | 3.33 | 8.33 | 19.067 | 21.16 | 95.56 | 23.89 | 104.8 | 53.43 | 5.7 | 83 | 114.67 |
| Badhganga | 396.517 | 3 | 3.33 | 6.67 | 18.253 | 24.37 | 82.76 | 44.97 | 101.5 | 48.82 | 5.122 | 73.67 | 115 |
| Swargadwari | 427.77 | 3 | 3.33 | 8.33 | 18.94 | 23.6 | 87.73 | 49.3 | 90.3 | 52.52 | 4.87 | 75 | 113.67 |
| WK 1204 | 789.8 | 4 | 1.33 | 18.33 | 15.83 | 13.94 | 86.67 | 35.75 | 89.23 | 35.96 | 4.43 | 82.33 | 114.67 |
| Dhaulagiri | 567.49 | 3 | 2.67 | 15 | 15.37 | 14.56 | 95.7 | 45.06 | 81.98 | 46.19 | 4.54 | 75.33 | 114 |
| RR-21 | 974.897 | 3.67 | 1.33 | 20 | 15.2 | 13.73 | 91.47 | 45.58 | 75.6 | 35.88 | 3.5 | 77 | 114.67 |
| CV | 35 | 9.254 | 25.04 | 20.087 | 22.15 | 6.758 | 5.1 | 2.725 | 5.45 | 7.377 | 6.782 | 8.718 | 0.95 |
| LSD | 90.79 | 0.38 | 0.79 | 5.15 | 1.91 | 1.69 | 4.31 | 3.89 | 11.15 | 5.01 | 0.68 | 1.24 | 0.77 |
| Mean±S.D | 579.43±167.13 | 2.75±0.69 | 2.33±0.98 | 13.75±5.52 | 16.74±1.98 | 19.57±4.14 | 93.6±6.37 | 41.9±6.78 | 89.3±10.8 | 43.64±6.79 | 4.64±0.6 | 77.22±3.03 | 114.08±0.87 |
| Maximum | 1008 | 4 | 4 | 20 | 20.2 | 27 | 105.6 | 50.34 | 112 | 55.49 | 6.21 | 83 | 115 |
| Minimum | 319.75 | 2 | 1 | 5 | 13 | 12.9 | 79.6 | 21.8 | 70.59 | 32 | 3.56 | 73 | 112 |
AUDPC: Area under Disease Progressive Curve, LS: Lesion Size, LTN: Leaf Tip Necrosis, SL: Spike Length, PE: Peduncle Extrusion, PH: Plant Height, LA: Leaf Area, EY: 50 Spikes/Ear Yield, TKW: Thousand Kernel Weight, PY: Plot Yield, DH: Days to Heading, DM: Days to Maturity, CV: Coefficient of Variation, LSD: Least Significant Difference, SD: Standard Deviation
Table 5: Pearson’s correlation coefficient table.
| AUDPC | LS | LTN | LM | SL | PE | PH | LA | EY | TKW | PY | DH | DM | |
|---|---|---|---|---|---|---|---|---|---|---|---|---|---|
| AUDPC | 1 | ||||||||||||
| LS | 0.57239** | 1 | |||||||||||
| LTN | -0.6263** | -0.37713* | 1 | ||||||||||
| LM | 0.65284** | 0.32699* | -0.7082** | 1 | |||||||||
| SL | -0.5689** | -0.3521* | 0.66083** | -0.648** | 1 | ||||||||
| PE | -0.8228** | -0.6206** | 0.6276** | -0.717** | 0.665** | 1 | |||||||
| PH | -0.05513 | -0.6001** | -0.16851 | 0.2544* | -0.073 | 0.0261 | 1 | ||||||
| LA | 0.14888 | 0.2982* | -0.02417 | 0.0591* | -0.0838* | -0.298* | -0.22** | 1 | |||||
| EY | -0.6023** | -0.3758* | 0.42766** | -0.545** | 0.5289** | 0.684** | 0.1179 | -0.4094* | 1 | ||||
| TKW | -0.7506** | -0.4946** | 0.6977** | -0.736** | 0.7353** | 0.749** | -0.0232 | -0.1999 | 0.5** | 1 | |||
| PY | -0.6205** | -0.3878* | 0.53408** | -0.712** | 0.6323** | 0.657** | -0.0724 | -0.3067* | 0.6** | 0.70** | 1 | ||
| DH | 0.14301 | -0.04084 | -0.207 | 0.10224 | 0.1023 | -0.021 | 0.0768 | -0.649** | 0.22* | -0.0145 | 0.29* | 1 | |
| DM | 0.16107 | 0.17716 | -0.2321* | 0.05175 | -0.0656 | 0.0049 | -0.367* | -0.326* | 0.11 | 0.01 | 0.164 | 0.41* | 1 |
** Highly significant * Significant (at 5% level of significance)
AUDPC: Area under Disease Progressive Curve, LS: Lesion Size, LTN: Leaf Tip Necrosis, SL: Spike Length, PE: Peduncle Extrusion, PH: Plant Height, LA: Leaf Area, EY: 50 Spikes/Ear Yield, TKW: Thousand Kernel Weight, PY: Plot Yield, DH: Days to Heading, DM: Days to Maturity
AUDPC and Thousand kernel weight (TKW)
The graph shows the relationship of 12 wheat varieties with Area under Disease Progressive Curve (AUDPC) and thousand kernel weight (TKW) (Figure 2).
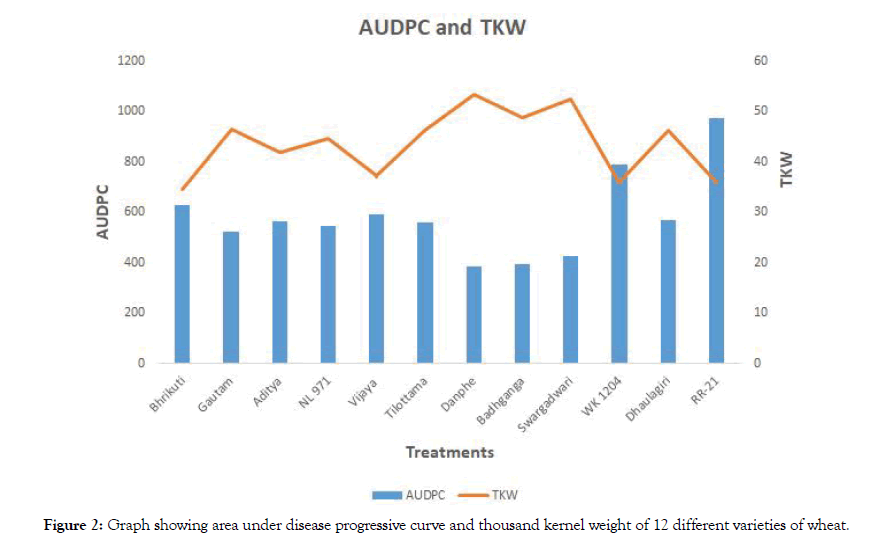
Figure 2: Graph showing area under disease progressive curve and thousand kernel weight of 12 different varieties of wheat.
Area under disease progressive curve (AUDPC) was calculated based on disease intensity. Treatments varied significantly in AUDPC values. Danphe had the lowest AUDPC and RR 21 had the highest AUDPC value with the mean value of 383.70 and 974.90 respectively. The maximum test weight was recorded in Danphe (53.43 gm) and least was recorded in Bhrikuti (34.527 gm). AUDPC value of all three replication ranged from 319.75 (Danphe) to 1008.02 (RR 21). Thousand kernel weight (TKW) value among three replications ranged from 32 g (Bhrikuti) to 55.49 g (Danphe). There was significant negative correlation between the mean AUDPC and test weight. It was in accordance to findings of Kwasna [16], Sharma et al., [17], Neupane et al., [18] they found negative correlation between area under disease progressive curve and thousand kernel weight.
Conclusion
On the basis of mean AUDPC value, the varieties were categorized under four resistance categories i.e., resistant, moderately resistant, susceptible and highly susceptible. Among 12 varieties RR-21 (974.897) was categorized as highly susceptible. WK-1204 (789.8) and Bhrikuti (627.983) were categorized as susceptible varieties. No varieties were found highly resistant. Similarly, Swargadwari (427.77), Gautam (522.84), NL 971 (545.87), Tilottama (561.73), Aditya (563.17), Dhaulagiri (567.49) and Vijaya (591.976) appeared moderately resistant to spot blotch of wheat. In reference to the research conducted, performance of wheat varieties varied significantly with response to spot blotch in different parameters in field condition at NWRP, Bhairahawa. Among different varieties of wheat, Danphe was found to be the most resistant followed by Badhganga against spot blotch in reference to NWRP, Bhairahawa. So, Danphe variety of wheat can be recommended for cultivation under the climatic condition of Rupandehi district. Similarly, RR- 21 appeared highly susceptible to spot blotch and can be used as susceptible check and these varieties can be suggested to incorporate into breeding program.
Acknowledgements
We express our profound gratitude and sincere appreciation to our advisor Mr. Rajan Paudel, Assistant Professor, Department of Horticulture and Plant Protection, IAAS, Paklihawa, member of advisory committee Assistant Professor Anju Pandey, Mr. Shiv Ratna Gupt, Scientist-1, National Wheat Research Program (NWRP), Campus Chief Prof. Dr. Kanhaiya Prasad Singh, Institute of Agriculture and Animal Sciences for their valuable suggestions and constructive criticism during the entire period of our work. We express our deep sense of gratitude to IAAS, Paklihawa Campus administration for allowing a sound environment to perform our tasks. We will forever remain loyal to this esteemed University. Our intense gratitude goes to our parents for all the blessings, support and encouragement they offered on our behalf during the course of our stay far away from home. We would like to express our sincere thanks for support and cooperation of our friends Amrit, Ashmita, Bipin, Pramila and Saraswati without whom, this UPA would have not been success.
Finally, we would like to acknowledge all those individuals who helped us directly or indirectly during our study and manuscript preparation.
REFERENCES
- Briggle LW, Reitz LP. Classification of Triticum species and of wheat varieties grown in the United States. US Department of Agriculture. 1963.
- FAO. Food and Agriculture Organization. Rome, Italy. 2014.
- Aryal L, Shrestha SM. Effect of date of sowing on the performance of drought tolerant wheat genotypes to spot blotch at Rampur, Chitwan, Nepal. Int J Appl Sci Biotechnol. 2013;1(4):266-271.
- Asad S, Iftikhar S, Munir A, Ahmad I. Characterization of Bipolaris sorokiniana isolated from different agro-ecological zones of wheat production in Pakistan. Pak J Bot. 2009;41(1):301-308.
- Basnet R, Pokherel DN, Pandey D, Dangi SR. Performance of wheat genotypes (Triticum aestivum L.) for foliar blight resistant at late sown condition in Nepal. Int J Cur Res. 2016;8(12):4178-4182.
- Bhandari D. Response of wheat genotypes to seed infection, root rot and spot blotch caused by Bipolaris sorokiniana and its pathogen variability. M.S. Thesis (unpublished), Institute of Agriculture and Animal Science, Rampur, Chitwan, Nepal. 2001.
- Bhatta MR, Pokharel DR, Devkota RN, Dubin HJ, Mudwari A, Bimb HP, et al. Breeding for Helminthosporium blights resistance in Nepal: strategy followed by the national wheat research program and genetic gains. InProc. Int. Workshop Helminthosporium Diseases of Wheat: Spot Blotch and Tan Spot, CIMMYT, El Batan, Mexico 1997; 188-195.
- Bisen PS, Channy B. Some observations on the surface of wheat leaves during the early stages of infection by Helminthosporium sativum (PK & B.). J Ind Bot Soc. 1983;62(3):285-287.
- Chand R, Singh HV, Joshi AK, Duveiller E. Physiological and morphological aspects of Bipolaris sorokiniana conidia surviving on wheat straw. Plant Pathol J. 2002;18(6):328-332..
- Duveiller E, Dubin HJ. Helminthosporium leaf blights: spot blotch and tan spot. FAO Plant Production and Protection Series (FAO). 2002.
- Duveiller E, Kandel YR, Sharma RC, Shrestha SM. Epidemiology of foliar blights (spot blotch and tan spot) of wheat in the plains bordering the Himalayas. Phytopathol. 2005;95(3):248-256.
- Duveiller E. Controlling foliar blights of wheat in the rice-wheat systems of Asia. Plant Dis. 2004;88(5): 552-556.
- Duveiller E. Helminthosporium Blights of Wheat: Spot Blotch and Tan Spot: Proceedings of an International Workshop Held at CIMMYT, El-Batan, Mexico, 1997.
- Duveiller E, Gilchrist L. Production constraints due to Bipolaris sorokiniana in wheat: current situation and future prospects. In Wheat in Warm Area, Rice-Wheat Farming Systems. Dinajpur (Bangladesh). 1994.
- Duveiller E, Sharma RC. Genetic improvement and crop management strategies to minimize yield losses in warm non-traditional wheat growing areas due to Spot blotch pathogen Cochliobolus sativus. J Phytopathol. 2009;157: 521–534.
- Kwasna H. Ecology, taxonomy and nomenclature of Helminthosporia history and actual situation. Helminthosporia—Metabolites, Biology, Plant Diseases: Bipolaris, Drechslera, Exserohilum (Chelkowski J., ed.). Poznan, Poland: Institute of Plant Genetics, Polish Academy of Science. 1995;27-60.
- Sharma RC, Duveiller E, Ortiz-Ferrara G. Progress and challenge towards reducing wheat spot blotch threat in the Eastern Gangetic Plains of South Asia: is climate change already taking its toll? Field Crop Res. 2007;103(2):109-118.
- Neupane SP, Ojha BR, Ghimire SK, Sah SK, Shrestha SM, Puri RR. Morpho-physiology of wheat genotypes under different sowing dates as affected by Helminthosporium leaf blight and leaf rust in Chiwan, Nepal. Agro J Nepal. 2013;3:109-116.
Citation: Paneru A, Gahatraj B, Poudel M, Subedi P, Sovana GC, Paudel R (2020) Field Experiment to Evaluate the Response of Different Varieties of Wheat against Spot Blotch (Bipolaris sorokiniana) at Bhairahawa, Nepal. J Plant Pathol Microbiol 11:525. doi: 10.35248/2157-7471.20.11.525
Copyright: © 2020 Paneru A, et al. This is an open-access article distributed under the terms of the Creative Commons Attribution License, which permits unrestricted use, distribution, and reproduction in any medium, provided the original author and source are credited.
