


Indexed In
- Open J Gate
- RefSeek
- Hamdard University
- EBSCO A-Z
- Scholarsteer
- Publons
- Euro Pub
- Google Scholar
Useful Links
Share This Page
Journal Flyer

Open Access Journals
- Agri and Aquaculture
- Biochemistry
- Bioinformatics & Systems Biology
- Business & Management
- Chemistry
- Clinical Sciences
- Engineering
- Food & Nutrition
- General Science
- Genetics & Molecular Biology
- Immunology & Microbiology
- Medical Sciences
- Neuroscience & Psychology
- Nursing & Health Care
- Pharmaceutical Sciences
Research Article - (2021) Volume 9, Issue 6
FACTORS AFFECTING TURNOVER TAX COLLECTION PERFORMANCE: A CASE OF WEST SHOA SELECTED WOREDAS
Dejene Debebe Kibret*Received: 24-Jan-2021 Published: 25-Jul-2021, DOI: 10.35248/2472-114X.21.9.214
Abstract
The purpose of this study was to determine the factors affecting turnover tax collection performance in West Shoa Zone selected Woredas. In 2017/18 the targeted revenue was 9041224 birr with the actual revenue being 7888536 birr (equivalent to 87.25% or a difference of 1152688) was existence of turnover tax collection gap. This study was using mixed research approach. Systematic random sampling used to selected taxpayers and purposive sampling to selected Woreda tax officers. Sample sizes of 373 respondents were selected from Nono, Chaliya and Ejere Woreda. Questionnaires and interview were used to collect data. The multiple linear regression method using the SPSS software 20 and factor analysis was used to analyze the data. Findings of this study revealed that; employee qualification and manpower, taxpayer registrations, technology and information system, management commitment level, tax audit, turnover tax rate and tax knowledge affects the revenue performance of turnover tax positively. It was also revealed that the perpetuation of tax evasion and tax fairness affects the revenue performance of turnover tax negatively whereas compliance cost and tax avoidance has a negative relationship with turnover tax performance but found statistically insignificant. The study concluded that there are problems facing the revenue administration office while collecting turnover tax revenue. Based on the study it is recommended that revenue authority need to develop their strategic management commitment , recruit sufficient number of employees and continues training on qualification, maintaining tax fairness and equity, improve taxpayer identification and registration, should increase the number of users of Electronic Tax Register, they should be control tax evasion, fixed turnover tax rate with legal actions should be taken to people found guilty, conducting extensive tax knowledge (awareness) creation programs to update and maximize frequency tax audit effective on field compromising should be a priority task.
Keywords
Revenue Collection performance; revenue authority; West Shoa; Ethiopia
Background of the Study
Turnover tax is available to individuals (sole proprietors), partnerships, close corporations, companies and co-operatives and it is elective i.e. qualifying small businesses can choose to register for the standard tax system or for turnover tax. Unlike the income tax system that makes use of comprehensive inclusion rules and a reduction process that requires proof of expenditure to be maintained, the Turnover Tax will be calculated by simply applying a tax rate to a “taxable turnover”. Nations that use a turnover tax have parameters in place to determine when such taxes should be assessed, and at what rate. Under a value added tax, a little bit more tax is paid at each stage to collect the desired amount. Cascade taxes, on the other hand, do not account for taxes already paid, with a new tax being collected at each phase [1].
The nature of consumption of public goods is such that consumption by one does not reduce consumption for others.
Besides, consumption of public goods by an agent does not exclude others from doing same. Such nature of public goods therefore makes them impossible for private suppliers to avail them at market prices like other commodities. Government intervention in the supply of public goods is therefore inevitable and can only be done if the public pays taxes for the production and supply of such goods. Although governments must spend money on tax collection activities, some of the costs, particularly for keeping records and filling out forms, are borne by businesses and by private individuals [2].
A turnover tax is similar to a sales tax or a value added tax (VAT), with the difference that it taxes intermediate and possibly capital goods. It is an indirect tax, typically on an ad valorem basis (meaning that they are based on the value of the good in question, rather than being flat taxes), applicable to a production process or stage. Turnover tax is at a very low rate compared to most taxes, but it is calculated on gross income without any deductions. Turnover Tax was implemented with the intention of improving tax compliance however; it may not always be as advantageous as thought to be. Careful consideration and calculations need to be performed in order to assess whether Turnover Tax is favorable for the business concerned [3]. Turnover Tax was implemented in order to simplify very complex tax rules and regulations. The fact that Turnover Tax is perceived to be simpler to comply with does not necessarily mean that the associated tax payable is fair. This simplified tax system may potentially be burdening the taxpayer even more than the complex Income tax system
Some of the problems regarding the informal sector that exist under the income tax are likely to remain so, particularly those involving cash transactions made in the informal economy or with the explicit intent of evading taxation. However, as the costs of compliance reduce and the perceived fairness of the tax system increases, some of the hostilities to the turnover tax system may decline. Businesses that are in non-compliance because they perceive the present system as unfair or illegitimate may choose to comply. Research has confirmed the intuitive relationship between higher marginal tax rates and higher rates of evasion. Lower rates, all other things being equal, imply lower evasion because the benefits from evasion decline while the costs of evasion remain comparable [4].
When we come to the Ethiopian context government Proclamation No. 308/2002, TOT is applicable to any resident person whose turnover from business does not exceeds 500,000 during any year of income. Turnover tax is imposed on the supply of taxable goods and services by persons not registered for VAT. It is chargeable at 2 per cent on locally sold goods and services (including services by grain mills, tractors and combine-harvesters) and 10 per cent on all other services. Unlike VAT, TOT paid on inputs cannot be credited against TOT on outputs and businesses are not allowed for any refund in this regard.
Therefore, turnover tax collection performance can be affected by different factors. In turnover tax revenue practice there are internal and external factors which affect the tax revenue amount selected Woredas. The researcher declares that; identify factors affecting Turnover tax collection performance from those; this paper focused on enforcement of law and regulation, effectiveness of TOT administration practice and taxpayers attitude toward payment of tax in selected Woredas.
Statement Problem
Today’s worldwide popularity revenue collection is very important for every government in the world as it enables the government to acquire assets which are not liable to debt and which the government uses to develop its economy. Tax administration therefore, should aim at improving on laws regarding the registration, assessment, collection revenue, and exploiting fully taxation potential of a country. However, a significant number of encountered different problems when trying to introduce the Turnover tax collection performance in their revenue authority.
Previous studies [5] posits identified factors affecting revenue collection that include services delivery ,staff motivation ,legislation, public participation, employee competency and integrating information and technology and payment was identified to the main challenges that inhibits revenue collection. There is methodology gap by analyze descriptive statics and the problem will address are rise still real challenges on the ground. [6] further argues that challenges affects turnover tax collection that include taxpayers’ ignorance of their obligations, prohibitive rate of turnover tax, rate of payment affects tax collection. Although studies made on factors influence turnover tax collection compliance [7]. However, while the taxpayer’s attitude on compliance still influenced differing from one country to another and also from one individual to another.
In Ethiopia, TOT collection faces diverse factors internal and external tax administration challenges and issues. Ethiopia has faced budget deficit every year since introduction of TOT is an affirmative action which was aimed at incorporating the SME sector into national taxation system. However, the performance of TOT has not been satisfactory and TOT revenue has been below average in 2017/2018 years since its inception. According to ERCA (total revenue collected from the TOT less than against target collection each year). On TOT recruitment, the performance has on average been below 70% [8].
Others studies [9] forwarded that Imposition of tax couldn’t still bring the required result due to a number of reasons such as lack of clear understanding about the tax system by the tax payers, tax payers don’t comply with their tax obligation, hostility between the tax payers and tax officials, economical factors, negative attitude of tax payer towards the tax system, that is, understating their taxable income by significant amount and related. For these reasons, the actual amount of tax couldn’t be collected properly. However, these studies were the gap into measure revenue performance and identify the problem that this study sought to address. Despite of selected Woredas revenue authority has been facing various factors affect which make it not to attain at most (100%) the projected targets. In 2017/18 the targeted revenue was million 9041224 with the actual revenue being million 7888536 (87.25%) the existence of turnover tax collection gap.
From the above studies it can be possible to generalize that to evaluate factors affecting turnover tax collection performance. This study was, therefore; undertaken to bridge the research gap through discovering factors which affect TOT performance by taking the case of some selected Woredas of West Shoa Zone of Oromia Region through answering the following research questions.
Significance of the Study
This study is a micro level investigation of public sector; hence the findings of the study was believed to be primarily significant to the taxpayers and the tax authority in order to boost the performance that fall under turnover tax collection in the Public revenue. It is obvious that an effective and efficient administration and collection of taxes system, the government revenue helps to fulfill the socio-economic needs of the society improve. Hence this research thesis can indicate the ways that what the authority was give some possible insights to the revenue to tackle the factors identify this finding, initiates the authority to give closer attention towards the administration and taxpayers as well as conduct awareness creation programs to achieve the desire objectives of turnover tax collection, improve government revenue performance those who want to conduct a full time research. Finally the findings were also help to motivate the revenue authority to identify their work periodically and take remedial action for their deficiencies.
Scope of the Study
The scope of this study will limit to basically deals with factors affecting turnover tax collection performance in revenue authority starting from the introduction of the TOT proclamation. This data will gathered from tax administration department and some taxpayers in revenue authority. While it is difficult to cover the whole register taxpayers the study is delimited to some select register taxpayers and employees of revenue authority.
This is so because the researcher strongly believes to identifying factors which affecting turnover tax collection such as: - effectiveness of TOT administrator practices, enforcement law and regulation, taxpayer’s attitude toward payment of tax on revenue performance. This research focuses only on turnover tax collection, trends of turnover tax performance in last six years of west shoa zone revenue authority selected Woreda.
Organization of the Paper
This Thesis attempts to identify factors affecting the turnover tax collection performance on west shoa zone revenue authority of selected Woredas. Accordingly, the paper is organize in the following way that chapter one deals with the introduction of the study, the second chapter deals with review of literature both theoretical and conceptual ones, in the third chapter, a discussion is present on the adoption of material and method for this research, the fourth chapter deals with result and data analysis, discussion. Finally, chapter five contains summary, conclusion and recommendation.
The Concept of Turnover Tax
Turnover taxes are multistage sales taxes that are levied at some fixed rate on transactions at all levels of production. The effective tax rate on various goods and services is conditioned by the number of stages of production. Turnover taxes can also be punitive in nature, designed to create a disincentive for buying particular products. The turnover tax provides an incentive to vertical integration among firms so as to reduce the number of production stages and inter firm transactions the tax usually is reflected in higher final consumption prices. The turnover tax is an extremely productive levy, producing high, stable yields at very low rates. The reason for the high yield is the sheer number of transactions taxed, plus the pyramiding of tax rates on tax rates for multistage production, considerably increasing the final effective rate of taxation. The Turnover tax would be payable on goods sold and services rendered by persons not registered for Value Added Tax. The base of computation of the turnover tax is the gross receipts in respect of goods supplied or services rendered. A person who sells goods and services has the obligation to collect the turnover tax from the buyer and transfer it to the tax authority. Hence, the seller is principally accountable for the payment of the tax [10].
Benefit Received Taxation Theory
According to benefit received principle argues that the means of financing government supplied goods and services should be linked to the benefits that citizens receive from government. From the point of view of those who favor the benefit approach, fees and charges are ideal forms of government finance. Charges, like prices, distribute the costs of goods and services among those who consume them. A distribution of tax shares per unit of a pure public good that reflects marginal benefits received by taxpayers induces individual citizens to vote for the efficient output of that good. This principle has been condemned because, first, if the state keeps a certain linking between the benefits given and the benefits received, it will be in contradiction of the basic principle of the tax.
According to this theory there should be some benefit to those who pay TOT [11].
Ability to Pay Taxation Theory
The taxes should be distributed according to the capacity of taxpayers to pay them. Citizens with greater ability to earn income, for example, should be taxed more heavily than those with less capacity to earn. Using this approach, the problem of distributing tax shares is viewed as independent of individual marginal benefits received from government activities. The implementation of a tax system based on the ability to pay requires some collective agreement concerning an equitable distribution of the taxes among citizens. This theory is indeed the most equitable tax system since people with greater income or wealth and can afford to pay more taxes should be taxed at a higher rate than people with less individual income tax and has been widely used in industrial economies. The Ability-to-Pay theory is of the view that individual should be taxed based on the individuals’ ability to pay as well as the monetary transactions of the individuals should be taxed at a fixed percentage. This theory suggests that the tax payers of TOT should pay unconditionally and according to their paying capacity [11].
TOT in Ethiopia: History and Legal Frame Work
The government considers, for administrative feasibility and other reasons, persons whose annual taxable transaction not exceeds 500,000 to be registered for TOT and it is necessary to impose obligation of taxation. Turnover tax is imposed on those not registered for VAT to equalize and enhance fairness in commercial relations and make complete the coverage of tax system so as to increase government’s revenue from taxation.
Scope of Turnover Tax
According to turn over tax proclamation 308 (2002) is on: supply of goods, rendition of services, persons not registered for VAT.
I. Supply of goods
Goods” is defined under Art 2(7) of proc 308(2002) is to mean any kind of goods or commodity that has exchange value, utility and brings about satisfaction and includes animals.
II. Rendition of services
Services rendered to persons not registered for VAT are under the scope of turn over tax proclamation. Regarding the definition for the term service since the turn over proc fails to deal with it as per Art 2(1) of proc 308/2002 Cum Art 2(7) of proc 285(2002) it is to mean work done for others which doesn’t result in the transfer of good.
III. Persons not registered for VAT
According to Art 2(4) of proc 308/2002” a person not registered” is a person who is not registered for VAT by reason of his annual turnover being below 500,000 or threshold set by the minister, by reason of not having applied for voluntary registration.
Rates of Turnover Tax
The base to compute turnover tax is the goods receipts in respect of goods supplied or service rendered (Art 5). Thus, the person who sells goods and services has the obligation to collect the turnover tax from the buyer and transfer collected tax authority. Art 4 incorporates two kinds of rates: 2% on goods sold locally and for services rendered locally again in two rates: 2% for contractors, grain mails, tractors and combine-harvesters and 10% on others.
Obligations of Taxpayers under the Turnover Tax Law
In enforcing turnover tax proclamation there are obligations imposed on tax payers and other concerned organs; establishment of organs responsible to enforce the laws; pass decisions and review the decisions in case complaint is lodged by aggrieved party. Some of the obligations on taxpayers include:
I. Filing of Turnover Tax Return and payment
Turnover tax is to be declared and paid by taxpayer. The outstanding obligation imposed on them is to file their tax return and pay the tax within the time reasonable in the proclamation. Art 10(1) Taxpayers subject to turnover tax shall provide that:
a. File a turnover tax return with the tax authority with one month after the end of every accounting period. b. Pay the tax for every accounting period by the deadline for filing the turnover tax return. Each taxpayer is thus required to file a turnover tax return to the tax authority before the deadline mentioned above. The taxpayers by implication are logically imposed to make correct calculations based on the rates stated under Art 4. Art 10(2) for the purpose of this Article “Accounting period” shall mean:
a) For tax payers classified as category “A” tax payers under the income tax proclamation No. 286/2002, but are not required registering for VAT, the calendar month;
b) For category “B” tax payers who are required to keep records under the income tax proc. No. 286/2002, each three month period commencing from the first day of the Ethiopian fiscal year or when approved by the Tax Authority, the first day of the Gregorian Calendar year;
c) For category “C” tax payers, who are not required to keep records under Income Tax proclamation No. 286/2002, the fiscal year?
II. Keeping Recodes
Taxpayers subject to the record-keeping requirement of Article (48) of the Income Tax Proclamation No.286/2002 shall keep the records prescribed therein for use in determining Turnover Tax. File a turnover tax return with the tax authority within one month after the end of every accounting period and Pay the tax for every accounting period by the deadline for filing the Turnover Tax return. The records shall also follow acceptable principles of accounting that can be presented as evidence incase conflict arises between tax payers and tax authority with regard to assessment of taxation.
III. Notification of changes
Taxpayers the right to impose the obligation of notifying one’s address if the tax payer moves from his principal residence to another abode. Art 17 a registered taxpayer shall notify the authority in writing of any change in the name, address, place of business, constitution or nature of the principal taxable activity the person; and any change of address from which, or name in which, a taxable activity is carried on by the registered person with 21 days following such change.
Determinant of Turnover Tax performance
Effectiveness of TOT administration and Revenue Performance
According to Kayaga L et al. Tax Administration practice involves tax assessment, collection, and accounting of all types of taxes, as well as the implementation of relevant tax laws and governmental policies. The tax administrations capabilities are mainly caused by the following factors [12].
Employee Qualification and man power
Staff training is the establishment of learning, development and teaching opportunities in order to advance individual, team and managerial performance. It is progress that arises from a clear dream about people’s capacities and potential and operates within a corporate framework [13]. As Bird RM et al. noted that in personal assessments training, the training is geared more to increasing the human capital of the staff member, the training increases the employee’s skills upcoming assignments at the workplace thus lead to increase the organizational effectiveness. Also further notes that, financial constraints has led to hiring of tax officials who lack understanding of the tax laws they are administering and the concepts of accounting that are requisite to analyzing returns [14].
Qualified, well trained and motivated tax officials are crucial for the collection of taxes and the performance of tax administration bodies as a whole are what actually most developing countries lack and this forced to organize their activities under the existing tax administration structure to motivate tax officials with interests of government and reduce their vulnerability to corruption, attention has given to wages and other incentives [15]. Kayaga L et al. Argues that, faults in revenue collection and instance inadequate tax assortments. Developing states according to the academic faces a problem of incompetent tax supervision [16].
The preceding problem is attributed to with inadequate administrative work with necessary skills, and high level of illiteracy among taxpayers and tax collectors.
Management Commitment level
Structure deploys accountabilities so that the organization can achieve its goals and objectives and, ultimately, its mission. Managers Operations are also agents of the people and stewards of the democratic process and are morally obligated to embody the public interest and the constitutional governance process during strategic planning. Decision-flow processes, however, are the vehicles companies use to integrate results into coherent patterns for developing, implementing, and controlling decision making What's necessary to help reach this goal is a higher degree of transparency in the decision-making process.
When implementing TOT, the most important facet is top management's commitment to the TOT implementing strategic direction itself. In fact, this commitment is a prerequisite for TOT implementation. To implement adoption of TOT collection successfully, senior executives must not assume that lower-level managers have the same perceptions of the TOT strategy and its implementation, its underlying rationale, and its urgency. Top managers have to show their dedication to the effort and a positive sign for all affected employees [17]. He also argues that management culture is a set of socially acquired values that managers accepts as a whole and transmits to its members through language and symbols. As a result, management culture reflects a society’s shared meanings and thus making organizations more proactive and tax compliant.
Taxpayers registration
The registration and recording of taxpayer information is one of the fundamental functions of the Tax Administration and, to a great extent, drives how other core administrative functions operate. An inaccurate taxpayer database will inevitably lead to ineffective compliance programs. Taxpayer enumeration and registration: A good Tax Administration system should identify all those required to pay taxes and issue unique identification numbers that are fed into a master file upon which updates are made and from which retrievals can be made [18].
According to Fisman R et al. His research finds that taxpayer identification is one of the most important aspects of Tax Administration. This is because, as more taxpayers are located and registered, the taxpayers that would otherwise evade are reduced.
The timely and accurate collection and recording of basic identifying information of the taxpayer will permit the tax administration to understand its taxpayer base, staff itself accordingly, and to effectively plan other core tax administration functions. In short, the administration cannot manage its taxpayers if it does not know who they are, where they are located, and whether they are active or inactive [19]. Hence, noted that if taxpayers are identified and registered, it would enhance efficiency and significantly ease revenue collection.
Technology and Information system
A cash register is an electronic tool used to calculate and records sales transaction with a cash drawer that will be used to store cash. This machine automatically print receipt after a certain amount and the money transactions compared to manual transaction of sales. The computerization of all the processes steps plays an important role in minimizing the errors, standardization of the operational procedures and reducing costs. It may assure that the practice is in accordance with the current legislation. Furthermore, a computerized tax system may reduce the operational costs of revenue collections. With a reduction in expenditures, a probable residual budget may be invested in means to enhance the citizens’ welfare prioritizing the society needs [20].
The technological innovation has been an important matter in tax and revenue collection. The advent of new instruments to help businesses work more efficiently affects the way taxes and revenues are collected. Reforms to Government's financial management systems and processes are becoming critical in response to increasing demands for greater transparency and accountability in the management of the public's finances [21]. Information Communication Technology provides the opportunity to acquaint themselves with new strategies for effective lobbying, advocacy, design, implementation, and delivery of services to citizens by using those management information systems that meet local, national, regional, and international trends.
Compliance costs
Compliance costs normally include all costs associated with obeying the law, including planning and administration, in addition to the direct time and money spent filing paperwork. The tax laws and regulations are legal documents with legal language which is complicated for ordinary taxpayers to comprehend and given the numerous legal amendments every year, taxpayers lack necessary expertise to complete the tax returns. It also saves time and money for the small and medium businesses by engaging a tax consultant to complete the tax returns in the most efficient manner. Therefore, tax laws should be simplified to lower both compliance costs and administrative costs, to reduce uncertainty faced by taxpayers’ and to improve the levels of tax compliance [22].
The level of compliance costs falling on a taxpayer may be such that the taxpayer will choose to evade tax in order to compensate for what is seen as excessive compliance costs. In compliance costs have reached such a level where taxpayers could well opt to take the risk of being detected evading rather than spend the amounts required to determine their correct liability. Particularly small and medium sized enterprises (SME) suffer from high compliance costs. Tax compliance costs are the costs incurred by taxpayers in meeting the requirements laid on them by the tax law and the revenue authorities. These are costs over and above the actual payment of tax and over and above any distortion costs inherent in the nature of the tax. These costs would disappear if the tax was abolished.
Allingham MG et al. Also outlined three separate elements to the costs of compliance; namely monetary/fiscal costs, time costs and psychological costs. Monetary costs include sums incurred on tax professionals (i.e. tax agents and accountants) and expenses relating to taxation guides, books, communication and other incidental costs. All these efforts do amounts some cost bore by the taxpayer. He found out that compliance costs in the form of fees charged by tax consultants are positively correlated with non-compliance behavior and thus negatively correlated with tax compliance behavior. High compliance costs can result in tax avoidance, tax fraud, and inhibit investment by way of diminishing competitiveness of the country in terms of taxation attractiveness [23].
Turnover Tax rate
Effectively raise revenue through measures that suit a country’s circumstances and administrative capacity to identified high tax rates as one of the reasons of tax evasion. In fact, the structure of the overall tax system has an impact as well. If, for example, the tax rate on corporate profits is relatively low, but individuals are facing a high tax rate on their personal income, they may perceive their personal tax burden as unfair and choose to declare only a part of their income [24]. Too high tax rates was found to be another hampering obstacle to tax collection as tax payers were unable to pay tax to full amount or not paying at all as the tax rates were too high.
According to Small businesses are viewed as more likely to evade taxes since the owner, and beneficiary of tax evasion, is more likely to also be responsible for keeping the books and filing the tax returns [25]. [6] Concerning turnover tax rate, it was found to be prohibitive and higher than profit margins therefore affecting turnover tax collections. The formula for calculating the tax is not difficult and it did not affect tax collection.
Therefore tax rates and the overall structure of the tax system have a significant effect on the disposition to evade and avoid taxes. As per income tax regulation no. 410/2016, Art. 49/ 60, standard presumptive taxation is a fixed amount of tax liability determined by the tax authority based on annual turnover. Under such method, the income tax liability of the taxpayer is determined by applying the fixed rate of taxpayer’s taxable income estimated by the tax authority. In order to determine the estimated amount of the taxable income and the tax liability thereon, the authority considers various factors such as type of business, business size and location of business. The estimated tax liability of the taxpayer may continue from year to year until reversed by the authority or his/ her category is changed.
Tax evasion
Tax evasion is an outright dishonest action whereby the taxpayer endeavors to reduce his tax liability through the use of illegal means. One obvious consequence of tax evasion is the loss of tax revenue for government. The fact that some income goes untaxed and also certain direct taxes such as TOT are evaded, leads to the conclusion that tax revenues are lower than if everyone had paid their taxes. However, this tends to agree with who also suggested that a rational individual’s choice to evade will be based on the expected gains or losses associated with the decision.
Tax evasion usually entails taxpayers deliberately miss inter presenting or concealing the true state of their affairs to the tax authorities to reduce their tax liability, and includes, in particular, dishonest tax reporting (such as declaring less income, profits or gains than actually earned.
Tax evasion is achieved by intentional omission or commission, and these two are offensive as far as the laws guiding taxation are concerned. For example, a person may either intentionally or ignorantly decide not to declare his income to tax authorities or even if the income is declared, certain items may be omitted in order not to reveal the true financial position of such businesses [26]. Furthermore, a person may also include certain category of persons in his family data so as to gain a tax relief. All these are criminal offenses as far as taxation is concerned. To further the argument, [14] asserts that evaders in most developing countries can realistically assign expected value of zero to the likelihood of being detected and penalized; that the more severe the penalty, the less likely it is to be applied which showed a weakness in administration.
Tax Avoidance
Onoja ML et al. defined tax avoidance as the arrangement of tax payer’s affairs using tax shelters in the tax laws, and avoiding tax traps in the tax laws, so as to pay less tax than ought to be paid, hence the person pays less by taking the advantage of the loopholes in the tax laws. He also again asserted that, if you over do tax avoidance, you will eventually enter into tax evasion, tax evasion begins where tax avoidance ends. Tax avoidance refers to the payment of the least tax possible by taking advantage of the loopholes within the law [17]. This poses a danger to the collection of tax revenue as the least possible tax is paid over to the authorities which in some instances will be no tax paid at all. In today’s ever changing business environment, tax authorities cannot cover all the possible scenarios of business structures [27].
Tax avoidance is the art of escaping from tax burden without breaking tax laws. Even though tax avoidance is travelling within the framework of law or acting as per the language of the law in form, it is undesirable by government since it result in loss of revenue to the government and increase in the burden of the tax on the other taxpayers who do not resort to such practices [28]. Tax avoidance (effective tax planning) reduces the present value of tax payments and generally increases the after-tax rate of return to investors in a firm. Taxes affect financing choices, organizational form and restructuring decisions, payout policy, compensation policy and risk management decisions.
Tax Audit
Taxpayers are always not willing to pay their tax liability. They need to be motivated or forced to pay what are expected from them. Stated that failures to comply with the law are inevitable whether due to taxpayers’ ignorance, carelessness, recklessness and deliberate evasion, or weaknesses in administration. To the extent that such failures occur, governments, and in turn the communities they represent, are denied the tax revenues they need to provide services to citizens. The process of tax audit involves tax returns that underlying books and records of the taxpayers are examined critically to relate them to the tax return filed.
One of the most important tasks of the Tax Administration authorities is to set up internal control and accountability systems to detect errors in tax assessments. To ensure that taxpayers are not taxed incorrectly, the tax authorities must review appropriately tax laws to avoid deficiencies in laws, procedures, or practices that lead to errors [20]. However there are instances when it is not possible to verify the information got, and in such cases assessments are raised bearing in mind that the taxpayer or their representatives can easily challenge them.
Tax audit is therefore used as a financial tool to help the government in revenue generation by determining the level of compliance of an organization with tax law of the country [29,30]. Assert that there is a significant positive relationship between tax audit and revenue generation. That is an increase in tax audits increases revenue generation from taxes; tax audits also increase tax bases for the government and reduces tax fraud in the tax system. However, the role of an audit program in a modern tax administration must extend beyond merely verifying a taxpayer’s reported obligations and detection of discrepancies between a taxpayer’s declaration and supporting documentation.
Tax knowledge
According to Simon James et al. states that in addition to tax education, knowledge about tax laws also plays a major role in determining taxpayers’ compliance behavior. Therefore a step ahead, for example continuous education programmers and effective monitoring mechanisms must be taken into account by tax authorities to ascertain that taxpayers have a good and reasonable knowledge and understanding of tax matters. Tax educations promote taxpayers understanding of the tax systems, processes, law and associated penalty for defaulting. This tends to increase peoples propensity to comply with tax obligation, holding other things constant [31].
Educated taxpayers may be aware of non-compliance opportunities, but their potentially better understanding of the tax system and their higher level of moral development promotes a more favorable taxpayer attitude and therefore greater compliance [32]. He also suggested that higher education level are more likely to have a higher level of moral development and higher level attitudes toward compliance and thus will tend to comply more and improve tax performance.
Taxation knowledge is necessary to increase public awareness especially in areas concerning taxation laws, the role of tax in national development, and especially to explain how and where the money collected is spent by the government. Attitude towards tax compliance can be improved through the enhancement of taxation knowledge. When a taxpayer has a positive attitude towards tax, this will reduce his or her inclination to evade tax payment. [33] Provides studies on the importance of tax knowledge for taxpayers greatly affect the tax attitudes towards the tax system fair. Therefore, the knowledge of taxation owned by the taxpayer will affect the obedience of the taxpayer itself in carrying out its tax obligations. And will also affect the tax revenue received by the state if the people already have low tax knowledge.
Tax Fairness
According to Kothari CR et al. state that a major responsibility is to ensure that all taxpayers dealt with by a given official are accorded similar treatment and that all officials dealing with a given taxpayer would accord the same treatment. The problem of unfairness is that a tax system allows taxes to be shifted from dishonest to honest taxpayers. He also add argue that what is fair or equitable in taxation is inevitably a value judgment; no scientific specification of an equitable distribution pattern is possible, or people may be equal income wise while they may be unequal regarding their expenditure, wealth, total utility and so on [34].
According to Bird RM et al. stated three types of fairness’s, namely: horizontal, vertical, and, in the international context, internationally. Horizontal equity expresses the principle that similarly situated taxpayers should pay the same amounts of taxes because they have the same ability to pay. Vertical equity expresses the principle that those who are “better off” should bear a larger proportion of the tax burden while those who are “worse off” should bear less. Inter-nation equity centers on whether a tax system promotes a fair sharing of the international tax base, particularly among developing countries in relation to double taxation [16].
Similarly, stated, ‘Taxpayers feeling that they are unfairly treated by the tax administration compared to other taxpayers’, ‘discriminated by the tax administration (based on some network) forces even honest taxpayers to evade taxes. Studies in tax fairness and its influence to compliance behavior have been done findings show that tax evasion increased, as the percentage of taxpayers considering taxes unfairly.
Empirical evidence in support Turnover Tax collection
Several literatures show evidence on factor affect Turnover Tax collection applicability in different Revenue Authority. Turnover Tax has been applied in many different business communities; it must be considered whether the benefits of a turnover tax collection outweigh the time and costs of implementation.
In order to evaluate the effectiveness of the Turnover tax collection, it needs to be examined whether there is any proof that turnover tax collection have led to an improvement in revenue performance. Considering the huge amount of literature in this area, it is surprising to note that there is little empirical research performed on the factor affecting Turnover tax collection performances. Research also shows relatively little evidence showing whether an effective Turnover tax collection leads to an increase in performance. However, in order to undertake such an exercise, it is clear that the specific Turnover tax collection being implemented would need to be described.
Simiyu D et al. Carried Out the Study on “Challenges Affecting Collection of Turnover Tax”, Case Study: In Nairobi County Kenya, Kenyatta University, Kenya. This study identified crucial factors that were; Taxpayer’s ignorance of their obligations, mode of payment and the frequency of filing returns, Corruption and collusion between taxpayers, Government Policy formulation and quality of services to taxpayers. He concluded that the identified Challenges affecting collection of turnover tax Nairobi County [6].
Dave NM et al. carried out the study on “factors influencing turnover tax compliance in the Kenya revenue authority”, case study: domestic taxes department in Nairobi County, Nairobi University, Kenya. This study identified crucial factors that were; taxpayer’s perception of the tax system, taxpayer’s level of awareness, enforcement efforts by the revenue authority, costs of compliance. He concluded that the identified factors influencing turnover tax compliance in the Kenya revenue authority [7].
Conceptual Framework
Conceptual frame work explains the main things to be studied, the key factors, or variables and the assumed relationship among them. The framework depicts performance as influenced by variables including: three independent factor of Turnover tax collection performance: effectiveness of TOT administration practice, enforcement of law and regulation, taxpayer’s attitude toward payment of tax (Figure 1).

Figure 1: Conceptual frame work of the study.
Materials and Methods
Description of Study Area
The study was been factors affecting turnover tax collection performance on conduct in west shoa zone of Oromia regional state that is locate at the central part of the state. This zone takes its name from the Kingdom or former province of Shewa. The Zonal town is Ambo which is located in the West Shewa Zone of the Oromia Region, west of Addis Ababa, this town has a latitude and longitude of 8°59′N 37°51′E and an elevation of 2101 meters and it is located 112 Kms West of the capital Addis Ababa, on the road to Nekemte. Neighboring zones of West shoa are Amhara region in the North, East wollega and Horo Guduru zones in the west and North West, Jimma zone in south west, South west shoa zone in south east, and north shoa zone in south east. This research were study on West Shoa Zone such as:-Caliya, Ejere, and Nono select woreda of revenue authority. (Table 1) (Figure 2)
| District | Geographical location | Altitude (m.a.s.l.) | Temperature (°C) | Rainfall (mm) | |||||
|---|---|---|---|---|---|---|---|---|---|
| Latitude | Longitude | ||||||||
| Chaliya | 9° 02-9°1N | 37°25-37°16E | 1700 -3060 | 8- 25° | 750 -1000 | ||||
| Ejere | 8°51’-9°15’N | 38ο25’- 38ο28’E | 1872-3238 | 9- 28° | 900-1200 | ||||
| Nono | 7°41’-8°12’N | 36ο23’- 36ο25’E | 2152-3558 | 15- 32° | 1100-1500 | ||||
Table 1: Geographical location and climatic condition of the study districts.

Figure 2: Location of West Shoa zone setting.
Research Approach
The qualitative research approach
The qualitative research approach was used to provide descriptive forms which involved conducting questionnaires with in-depth interview. The choice for qualitative research approach was using in-depth interview questionnaires which would enable the researcher to gather detailed information, allow exploring and better understanding the complexity of a phenomenon.
Quantitative research approach
Quantitative research approach has its own strength. Its main strengths are that it generates precise, statistically reliable, extensiveness of attitudes held by people, numerical data from survey sizes and provides objective measure of reality. This research therefore was using both quantitative and qualitative research approaches and both methods are designed to address a specific type of research question with a primary purpose to identify factors affecting turnover tax collection performance on revenue authority of selected woredas. So quantitative data for this study were collected from woreda revenue office based on special table prepared collect six years revenue plan and actual performances.
Target population
According to [34], explain that the target population should have some observable characteristics, to which the researcher intends to generalize the results of the study. The population of interest for this study comprised of 3655 total turnover taxpayers created from information received from the west shoa zone revenue authority selected woreda records operating. Selected woredas was being particular focus for this study due to its low income concentration of business entities and diversity which make it easier for the researcher to get a representative sample from other woredas. (Table 2)
| No | Woreda | TOT taxpayers | No | Woreda | TOT taxpayers |
|---|---|---|---|---|---|
| 1 | Ambo | 1568 | 12 | Cobi | 1354 |
| 2 | Toke Tutaye | 1418 | 13 | Nono | 1225** |
| 3 | Ejerse Lafo | 1295 | 14 | Gindaberat | 1401 |
| 4 | Dandi | 1425 | 15 | A/Gindberat | 1485 |
| 5 | Ilfata | 1414 | 16 | Dano | 1473 |
| 6 | Chaliya | 1250* | 17 | Jibat | 1395 |
| 7 | Liban Jawi | 1339 | 18 | Bako Tibe | 1595 |
| 8 | Ilu gelan | 1255 | 19 | Ada’a Berga | 1660 |
| 9 | Ejere | 1180*** | 20 | Meta Walqixe | 1525 |
| 10 | Dire Incini | 1289 | 21 | Meta Robi | 1502 |
| 11 | Jeldu | 1264 | 22 | Mida Qanyi | 1428 |
| Total | 3655 | ||||
Sources: west shoa zone revenue authority, 2018
Table 2: Taxpayers Profile of West Shoa Zone Revenue Authority.
Sampling Methods
A sample according to [34] is a small group of respondents drawn from the population in which the researcher is interested in gaining information and drawing conclusions. Therefore sampling is a process of selecting a given number of representatives of the target population or the universe, in such a way that they represent all major attributes of the population. Two sampling techniques were employed in this study, namely systematic random sampling and purposive sampling.
Systematic Random Sampling
In this study systematic random sampling technique was used to get revenue authority tax payers. Systematic sampling is only the first unit is selected randomly and the remaining units of the sample are selected at fixed intervals. The researcher was taken turn over taxpayers in revenue authority of selected woredas with the reason that they had good exposure of factors affecting turnover tax collection performances.
Purposive sampling
Purposive sampling is also known as judgmental, selective or subjective sampling. It reflects a group of sampling techniques in which the selection of the sample is based on the judgment of the researcher as to which subjects best fit the criteria of the study. All selected woredas revenue authority officials was purposeful selected because turnover taxpayers registration and concentration of income performance from business entity were exist low with compare to other woredas.
Sample Size Determination
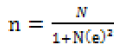
The researcher was being taking a number of factors into consideration in determining the sample size. The factors include cost of data collection and analysis, the type of data require for the study and number of target population. This require sample size determine at 95% confidence level and with 5% margin of error. The populations of this study were being three selected turnover taxpayers in revenue authority means Chaliya, Ejere and Nono which were adequate exposure in area of factors affecting turnover tax collection performance revenue authority. To calculate sample size, simplified formula provided by Taro Yamane (1967) is used because the researcher assumes homogeneity of the taxpayers and the existing resources to determine the sample size by the precision level.
Where, n = number of sample size
N = Total number of study population. e = level of confidence to have in the data or degree of freedom. They require sample size determined at 95% confidence level and with 5% margin of error. Sample size for Taxpayers
 (3.1)
(3.1)
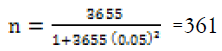
Revenue officers and department heads= 12, Total sample (sampled taxpayers +revenue officers) = 373 (Table 3)
| No | Type | Sampling method | ||||
|---|---|---|---|---|---|---|
| Chaliya | Ejere | Nono | Total | Purposive sampling(Woreda) | ||
| 1 | Taxpayers | 1250 | 1180 | 1225 | 3655 | Systematic sampling(taxpayers) |
| Sample size | 123 | 117 | 121 | 361 | ||
Table 3: Respondents profile.
Data collection takes place at the premise of the selected woreda from February 01 to 30, 2019. After pre testing, the structured survey questionnaire was administered on a total of 373 sample size. The taxpayers and revenue officer serve include in the sample willing to fill the questioner.
Source of data
The study used survey data as the main source of information in order to meet the study target, which represents primary and secondary data sources respectively. The primary data collected through a survey includes both qualitative and quantitative in its approach. Primary quantitative data was collected on the taxpayer’s activities while the primary qualitative data were collected through tax officer’s survey was collected through in-depth interview to triangulate with the taxpayers survey data. The researcher also used some secondary sources from documents available in the revenue office.
Method of Data Collection
Primary data collection methods
Questionnaires instrument
This study was largely depends on primary data, which collect through survey method by using structured questionnaires. Maintains that structured questionnaire allowed the participants to respond to the same questions, as participants are offered the same options on each statement to collect information from the respondents on their attitudes, feelings or reactions to the problem under study and it provided an efficient way of collecting responses from a large sample. Questionnaire distributed for taxpayers was two parts. The first part aimed at the collection of demographic information of the participants. The second part used five point Likert scales which measures the factors affecting turnover tax collection performance on taxpayer’s satisfaction. The taxpayers are requested to express their level of agreement or disagreement with the statement.
Questionnaire distributed for tax official was three parts. The first part aimed at the collection of demographic information of the participants. The second part used in-depth interview which triangulate level of agreement or disagreement requested by taxpayers. The third part used to evaluates turnover tax performance.
In-depth interview
An interview is a purposeful discussion and/or conversation with two or more people, and helps the researcher to gather valid and reliable data that are relevant to achieve research questions and objectives. Interviews might be unstructured (in-depth) conversations. Unstructured interview attempts to draw out information, attitudes, opinions, and beliefs around particular themes, ideas, and issues without the aid of predetermined questions.
Secondary data collection methods
The researcher obtained different documents in order to access accurate and reliable data. Documents comprised of guidelines, directives, policies and regulations (regarding turnover tax collection), books and annually turnover tax collection performance reports of six year (2013-2018) revenue authority.
Reliability and Validity Test
Reliability Research Test
Reliability of an instrument was measure the degree to which a research instrument yields consistent results or data after repeated trials. Reliability was defined as the extent to which a measurement is free of variable errors. Cronbach alpha was used to test the reliability of multi-items to estimate internal consistency reliability. It solves the purpose to measure of the reliability of questionnaire instrument.
Validity Research Test
According to Hair JF et al. validity is the degree to which an instrument measures what it is supposed to measure. To ensure Validity of an instrument was determined using the Content Validity Index (CVI) so as to minimize the errors in measurement. Therefore, the term refers to the extent to which an instrument asks the right questions in terms of accuracy.
Method of Data Analysis
Descriptive Analysis
To analyze, interpret and summarize the data, the researcher was used descriptive statistics. Descriptive statistics like frequency and percentage, mean, standard deviation and histogram present socio-economic variable, trends of historical revenue growth and the respondent level of agreement on the performance of revenue authority.
Qualitative data analysis
Qualitative data are observations or information assessed according to themes or categories inherent in the data collected, for produce narrative data that require analysis such as in-depth interview. Qualitative data is valued for its rich, in-depth, descriptive character, often not attainable using quantitative measures
Quantitative data Analysis
Ordinary least Square Regression model identifies the major factors of turnover tax performance. Ordinary least squares regression is generalized linear model technique that may be used to single response variable which effectively transforms the regression model so that the fit values are bound within the interval scale. According to Ordinary least squares models the relationship between dependent variable and collection of independent variables. This technique apply to single or multiple explanatory variables and also categorical explanatory variables that have been appropriately coded. To comply with the objective, the paper was primarily based on cross sectional data, which was collected through structured questionnaire.
A multiple linear regressions model and t-static was used to determine the relative importance of each independent variable influencing turnover tax performance. The study was conducted regression analysis using SPSS software package, to test the casual relationship between the turnover tax performance and eleventh determinant factors.
As noted in Gupta AS & Ogula S et al. there are basic assumptions required to show that the estimation technique, OLS, had a number of desirable properties, to this end diagnostic tests were performed to ensure whether the assumptions of the CLRM are violated or not in the model. The model misspecification tests include:
Test for Heteroskedasticity
Homoscedasticity refers to the assumption that dependent variables have equal levels of variance across the range of explanatory variables. If the variance is unequal across values of the explanatory variable, then the situation is known as heteroskedasticity. Homoscedasticity is important because the variance of the dependent variable should not be dominant in only a limited range of the explanatory values . This is usually detected in scattered plots in SPSS where the standard predicted values are regressed over the standard residuals. This is to mean the homogeneity or variability explains the relationship between the error estimates as the predicted values increase.
Any sort of pattern in the scattered plot indicates the presence of some kind of co movement and hence it can only be concluded; there is increase, decrease or consistency that results in the model prediction error aligning the predictor variables movement. Therefore it leads to the assertion that one or more of the predictor variables are explaining the error term. For this reason the errors in estimates should be inconsistent, exhibiting hetroscadasticity in the scattered plot, throwing out in different directions.
Test for Normality
Normality refers to the shape of the data distribution for an individual metric variable and its correspondence to the normal distribution. If there is a sufficiently large deviation from normal distribution, all resulting statistical tests are invalid. Normality of a variable can be assessed by statistical or graphical method (i.e. histogram and curve). Skewness and Kurtosis are two statistical measures to describe the shape of any distribution. The Kurtosis deals with the “peakedness” or “flatness” of the distribution of the variables compared to the normal distribution. When a distribution is normal, the values of skewness and kurtosis are zero.
A reliable graphical analysis of normality is the normal probability plot, which compares the cumulative distribution of actual data values with that of a normal distribution. If a distribution is normal, the line representing the actual data distribution follows the straight diagonal line formed by the normal distribution. The effects of sample size should be considered to test the normality of data and larger sample sizes reduce the detrimental effects of non-normality.
Test for Multicollinearity
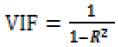
Multicolinearity is a statistical phenomenon in which there exists a perfect or exact relationship between the predictor variables. According to Field (2009), suggests that if the average VIF is greater than 1, then multi-Co linearity may be basing the regression model. Related to the VIF is the tolerance statistics, which is a reciprocal of VIF (1/VIF). So values of tolerance statistics below 0.1 indicates serious problem and below 0.2 are potential problem of concern. I.e. VIF > 10 there is an indication for multi-Co linearity to be present; with VIF > 100 there is certainly multi-Co linearity in the sample.
When there is a perfect or exact relationship between the predictor variables, it is difficult to come up with reliable estimates of their individual coefficients. It will result in incorrect conclusions about the relationship between outcome variable and predictor variables. The Variance Inflation Factor (VIF) quantifies the severity of multicollinearity in an ordinary least-squares regression analysis and is given by;
 (3.2)
(3.2)
To test independence of the explanatory variables the study used a correlation matrix of independent variables. The problem of multi-collinearity usually arises when certain explanatory variables are highly correlated. A correlation matrix used to ensure the correlation between explanatory variables.
Factor Analysis
According to Field, (2009) factor analysis is test the multi-dimensional scale in which all variables and on the extraction variances to construct a questionnaire to measure an underlying variable, understand the structure of a set of variables and to reduce data set to a more manageable size while retaining as much of the original information as possible to use the data were appropriate. A factor loading is a measure of how much the variable contributes to the factor; thus, high factor loading scores indicate that the dimensions of factors are better accounted by the variables.
Correlation
In statistic, correlation, (often measured as a correlation coefficient), indicates the strength and direction of a linear relationship between two random variables. The best known is the Pearson product-moment correlation coefficient, which is obtained by dividing the covariance of the two variables by the product of their standard deviations.
Pearson’s correlation reflects the degree of linear relationship between two variables. It ranges from +1 to-1. A correlation of “+1” means that there is a perfect positive linear relationship between variables and a correlation of “-1” means that there is a perfect negative linear relationship between variables. A correlation of “0” means there is no linear relationship between two variables.
Model Specification
The quantitative data was gathering through structure questionnaire process using SPSS (statistical package for social sciences) version 20 to get descriptive statistics results. All tests were one-tailed.
Significant levels were measured at 95% confidence level with significant differences recorded at p < 0.05. The relationship between dependent variable, turnover tax performance and several independent variables is express as a linear combination of independent variables plus error term. Following , the Multi-linear regression models are specifies as:
Y=β0+β1X1+β2X2+β3X3+β4X4+β5X5+β6X6+β7X7+β8X8+β9X9+β10X10+β1 1X11 + ε (3.3)
Turnover tax performance = β0 + β1EQMP + β2MCOMT +β3TREG+β4ITS + β5TCC + β6TRATE + β7TEV + β8TAVO +β9TAU+ β10TKNOW + β11TFAIR + ε
Operationalization and Measurement of Variables
The dependent variable
The dependent variable of the study was turnover tax performance. The researcher tries to measure these variables by ratio analysis. Ratio= Actual revenue collected X100
Target revenue collected The independent variablesThe researcher try to measure these variables using a 5 point Likert scale (1=strongly disagree 2=Disagree 3=Neutral 4=Agree 5= strongly agree) and Likert scale for only compliance cost (1=very low 2=low 3=fair 4=high 5 very high) to identify the overall level of respondents’ agreement. (Table 4)
| Independent Variables | Symbol | Categorical | Unit Measurement | Expected outcome(+/-) |
|---|---|---|---|---|
| Employee qualification and manpower | ESMP | Scale | Likert scale(1=strongly disagree 2=Disagree 3=Neutral 4=Agree 5= strongly agree) | + |
| Management Commitment | MCOMT | Scale | Likert scale(1=strongly disagree 2=Disagree 3=Neutral 4=Agree 5= strongly agree) | + |
| Taxpayers Registration | TREG | Scale | Likert scale(1=strongly disagree 2=Disagree 3=Neutral 4=Agree 5= strongly agree) | + |
| Technology and information system | ITS | Scale | Likert scale(1=strongly disagree 2=Disagree 3=Neutral 4=Agree 5= strongly agree) | + |
| Compliance cost | TCC | Scale | Likert scale(1=very low 2=low 3=fair 4=high 5 very high) | +/- |
| Turnover tax rates | TOT Rate | Scale | Likert scale(1=strongly disagree 2=Disagree 3=Neutral 4=Agree 5= strongly agree) | + |
| Tax Evasion | TEV | Scale | Likert scale(1=strongly disagree 2=Disagree 3=Neutral 4=Agree 5= strongly agree) | - |
| Tax avoidance | TAVO | Scale | Likert scale(1=strongly disagree 2=Disagree 3=Neutral 4=Agree 5= strongly agree) | - |
| Tax Audit | TAU | Scale | Likert scale(1=strongly disagree 2=Disagree 3=Neutral 4=Agree 5= strongly agree) | + |
| Tax Knowledge | TKNOW | Scale | Likert scale(1=strongly disagree 2=Disagree 3=Neutral 4=Agree 5= strongly agree) | + |
| Tax Fairness | TFAIR | Scale | Likert scale(1=strongly disagree 2=Disagree 3=Neutral 4=Agree 5= strongly agree) | - |
| Dependent Variables | Measures | Expected outcome (+/-) | ||
| Turnover tax performances | TOTP | Continuous | Tax ratio | +/- |
Table 4: Operational Measurement of independent and dependent variables of study.
Operation definition of Variable
Employee qualification and Manpower: the transferable skills needed by an individual depends on knowledge, qualification, adequate manpower and how you use those assets are technically competent to execute their roles and responsibilities on tax collection [15]
Management Commitment is direct participation by the highest level executive in a specific and willingness to exert considerable effort to maintain strong attitude towards pursuing a goal, strategies and policies implementation on behalf of authority [19].
Tax registration: is responsible for preparing and maintaining the assessment roll, the tax roll and collecting the tax levies in accordance with the quality standards and identify taxpayers.
Compliance cost: Taxpayers was adherence to the administrative rules of lodging such as procedural rules and regulations, filing tax returns and travelling cost on time, reporting all the income and claiming the right deductions and where taxes are due making tax payments on time [26] . Turnover tax Rates: is the rate at which a business or person is taxed on income. It also refers to the rate of tax on goods and services (income tax regulation no. 410/2016, Art. 49/ 60). Tax Audit: an examination of taxpayer’s business records, accounts and financial affairs to ascertain the taxpayer’s tax compliance and frequency of assessments done by revenue authority for tax obligations [17].
Tax avoidance: is legal reduction in tax liabilities by practices that take the full advantage of the tax code, such as income splitting and postponement of taxes.
Tax evasion: is illegal and intentional actions taken by individuals to reduce their legally due tax obligations. Individuals and firms can evade taxes by underreporting incomes, sales, or wealth, by overstating deductions or by failing to file appropriate tax returns.
Tax knowledge is the level of awareness or sensitivity of the taxpayers to tax legislation and other tax-related information.
Tax Fairness: is a system of taxation that is equitable for all taxpayers and based on a person ability to pay which greater incomes pay than low income people or small businesses.
Technology and information system: are key objectives of developing a revenue collection system which raise more revenue, improve internal organization, ensure greater accountability, transparency and improve taxpayer compliance [23]
Ethical Considerations
The ethical approval and clearance for the study before data collection was obtain from the College of Business and Economics, Ambo University. Consent was obtained from West shoa zone revenue authority select woreda such as: - Chaliya, Ejere and Nono after the purpose of the study also explain to the revenue authority. Research ethics refers to the type of the agreement that the researcher enters with the research participants.
According to Best & Khan and McMillan & Schumacher et al. ethical issues in research fall into one of the five categories:- protection from stress, harm, or danger; right to privacy, name and other identifying information , respondent was also knowledgeable that the information and confidentiality was maintain by assigning them code numbers instead of names (anonymity). The complete questionnaires was file safely and accessible only to the researcher.
Result and Discussion
Introduction
This chapter deals with seven sections. First section contains a summarized description of the demographics characteristics of the respondents followed by their respective business type or sector. The second section shows analysis turnover tax performance. The third section shows analysis of variables measures. The fourth section shows testing classical linear regression model assumption. The fifth section shows the regression analysis. The six sections were discussion and interpretation of finding. The data are collected and then analyzed in response to the problems posed in the first chapter of this study. These findings are based on the responses of sample taxpayers and tax officers with the help of a structured questionnaire and in-depth interview in the study area. Hypotheses are also tested with the study reject or failing to reject them depending on the p values and t test value [34].
Demographic characteristics respondents
As it was mentioned earlier in this section attempts to present the demographic characteristics of respondents selected from revenue office. The demographic factors in this section include respondents' profile such as age, gender, education level and backgrounds, stream or field of education they qualified, work experiences. These was help the researcher later to identify and relate the results of the findings based on respondent characteristics and to forward specific recommendation to its concerns.
The overall background of respondents from tax revenue office selected for this study. As the survey result indicates, the majority (58%) of the respondents’ age lay 36-50 years old while the rest 42% of the respondents are between 26-35 years old. Likewise the educational status of the respondents shows that 6 (50%) respondents are bachelor degree holders and the others 6(50%) respondents are diploma holders. Of these respondents, 41.6% are Accounting and finance, 41.6% of Management and others respondents are 16.8% economics, which are related professions pursuant selected woreda revenue authority.
The last but not the least element under respondents profile analysis was their work experience. Accordingly 25% of the respondents have a work experience between 4-6years. While the rest 75% of the respondents have more than 7 years’ work experience. This shows that more than half of the respondents (revenue officers) have a service years more than 7 year.
Demographic information for taxpayers
The study found it’s important to establish the demographic information in order to evaluate factors affecting turnover tax collection performance. The socioeconomic and demographic characteristic of the respondents determines their attitude the way they react to policies and strategies. At the beginning of the introduction of the TOT, some sort of resistance was observed. So after exerting efforts, a little change was observed. However, still observations show that there are some members of the business community who resisted to get registered for TOT. The demographic information of the respondents included gender, age, level of education, business activity, annual turnover and TIN registration are factors expected to influence the attitude of the respondents towards such newly introduced policies and strategies.
Gender Distribution of respondent
The study revealed that 243(74.77%) of respondents were males and 82(25.23%) of the respondents were females. This data has been represented in (Figure 3) below.This shows that males were dominant, comprising 74.77 percent and females were 25.23 percent of the total respondents are engaged in different business types in the study area.

Figure 3: Gender Distribution of respondents.
Age Distribution of Respondents
The researcher sought to find out the age distribution of the respondents and the following was the findings. The data for the study revealed that 0 (0%) of respondents were below 25 years while 154 (47.4%) of the respondents were within the age range of 26-35 years of age. Also, 115(35.4%) of respondents was fall within 36-45 years. However, 56(17.2%) of the respondents were within the category of 46 years and above. This has been represented in the (Figure 4). cont.

Figure 4: Age Distribution of Respondents.
From figure 4.2 it could be observed that, 47.4% of the respondents fall within the ages of 26-35 years. This represents the youth, those who have completed their schools and learning a TVET for started their own business. 35.4% of the respondents fall within the ages of 36 years to 46 years. This probably represents the men and women who are probable entrepreneur in their own small businesses. Also, 17.2% of the respondents who are 46 years and above are probably the old aged men and women who are traders in the selected woreda. The results observed from the findings that most of respondents were aged between 26-35 years making 47.4%. This means that majority of the small business enterprise owners are youths who according to the law fall under the age of 18-35 years.
Educational Background of Respondents
Education is relevant in all studies and this study is no different. In fact, education has a greater influence in the studies of turnover tax collection performance since it is considered an essential key to human development and the foremost agent of empowerment. Education may be used as a tool to improve taxpayers business through understanding net income, forecasting price of commodity as well be aware of different market commodities. (Figure 5)

Figure 5: Presents the educational background of respondents.
The results of the findings reveal that, 107(32.9%) of respondents were Primary school, 128(39.4%) were secondary school. Also 73 (22.5%) of respondents were TVET College whilst 12 (3.6%) of respondents had received university graduate. Then again, 5(1.6%) of the respondents fell within other level of education specifically, university post graduate. This findings of the study show that 72.3% of the respondents have less academic background that can help them to understand the tax laws and procedures and they do not have specific tax knowledge that can help them to comply with different turnover tax collection requirements, aside what they may have heard in the news or from friends and coworkers. This has a greater influence with respect the issue of turnover tax collection performance.
Marital Status of Respondents
The study revealed that, 96 (29.5%) of the total respondents were single, 221 representing 68% of the respondents were married. 5 of the respondents had divorced (1.5%) but 3(1%) of the respondents were widows. (Figure 6)

Figure 6: Marital Status of Respondents. Respondents had 6-9 (3%) child’s but 2(1%) of the responded
Only 221 respondents representing 68% of the total respondents said yes. This findings results that married tax payers are less risk takers than those of single tax payers in which married tax payers are less expected to paying tax as compared to single tax payers. Also married taxpayers were more social affiliation than single. A study conducted by [34] in Malaysia showed that 72% of the respondents were married whereas 28% were single which is similar with this study and this can show that married tax payers are less expected to paying tax as compared to single tax payers.
House hold size respondents
This study revealed that, 96 (30%) of the total respondents have no child’s, 130 (40%) of the total respondents have 1-3 child’s, 70 representing 27% of the respondents have 4-5childs. 10 of the (Figure 7)

Figure 7: House hold size respondents.
The result indicate that the majority of respondents 130 (40%) have 1-3 and above family members which are exist in selected woreda.
In business angle the researcher can show that family size were incorporated increasing they could not be easily become profitable.
Type of Business activity by Respondents
The researcher then sought to find out the type of business activity in by the respondents and the following data was retrieved and has been presented in the figure 4.6 cont. (Figure 8)

Figure 8: Type of Business activity by Respondents.
From the figure 4.6 above, as revealed by the study that 85(26.0%) respondents were engaged in the Shop , 59 (18.0 %) respondents were engage in Electronics goods and supply and Tailoring services were 55 (17.0%) of total population of respondents. Respondents that are involved in Grocery were 43(13.0%) and health care services were 35 (11.0%) and Cosmetics and Perfume Trade were 29 (9.0%) and Shoe trade were 19(6.0%) of total population of respondents. The results show their category of business they are engaged and gender that number of male in business in the selected woredas was greater than females.
Tax Identification Number
The researcher inquired as to whether the respondents business had a TIN. This was to determine if the businesses are registered for tax purposes as the TIN is a mandatory requirement for all operating businesses. (Figure 9)

Figure 9: Does your Business have a TIN.
As shown in figure 4.7, 88% of the businesses have a personal identification number while the rest 12% of the respondents believe that revenue offices do not properly identify all taxpayers every year. This in turn will create unfair competition to sale their products at a relatively higher price and TOT registered tax payers will lose their potential customers to illegal traders. Hence unregistered taxpayers did not pay tax to government. This finding confirm the finding of untrustworthy evidence from different developing countries indicates that calculates a sum of 37% of expected tax payers were not registered and hence did not pay tax to government.
Annual turnover
The researcher asks the respondents to indicate their business average annual turnover. This factor helps identify the correlation between income levels and cost a taxpayer attaches to compliance for calculate tax rate in terms of tax payments. Figure 4.8 shows the results of the findings. (Figure 10)

Figure 10: Annual turnover.
Respondents with an annual turnover of between 30000-100000 birr accounted for 39.0%, 29.70% who revealed they had annual turnover of between 100001- 200000 birr while 17.80% indicated that their annual turnover is between 200001-300000 birr and 10.20% said their turnover ranged between 300001 – 400000 birr. Also a few of the respondents forming 3.3% had annual turnover between 400001 to 500000 birr.
Analysis turnover tax collection Performance
The major objective of this study was to assess the six year revenue plan versus actual. To do this the researcher collected six year revenue plan versus actual revenue data from selected woreda revenue authority. (Figure 11).

Figure 11: Revenue plan vs. actual of six fiscal years.
Figure 11 above illustrates the revenue plan vs. actual revenue of the revenue authority office for the last six fiscal years. As we see from this figure the plan and achievement of revenue were steady aligning with each other for all five years and gradually fluctuating at the end of years, but the collecting capacity of the office was limited to small amount of revenue plan for these periods.
The revenue plan for fiscal years 2013 and 2014 were 4913922 and 5583922 respectively, which is very small as far the demand and potential of the Woreda is considered. This can be confirmed from 2015 and 2016 fiscal years in the figure above. As we see from this figure, the revenue plan for this period was 6038295 and 7860083 respectively, which are more than that of previous two years. Lastly, the revenue plans for the period of 2017 and 2018 was 8989784 and 9041224 respectively.
Apart from this, the revenue plans vs. actual for the period of 2017 was 8989784 and 8006080 respectively which is 89.06% of achievement. The final section for a revenue plan vs. actual comparison was for the period of 2018 which is the lowest of previous fiscal year's achievements. As we see from the fig 4.9 above the plan and actual for 2018 was 9041224 and 7888536 respectively. This is 87.2% successful and -1.5% loss compared to the previous (2017) fiscal year. This survey finding revealed that revenue office in selected Woreda from 2013 to 2018 the amount of tax collected was below the set target level with fluctuating and had never reached the annual target. This revealed that the revenue officers unable to solve the problem. As a result of this, the deviation continued for the last six consecutive years.
Validity Test
To ensure Validity of an instrument, the researcher used the Content Validity Index (CVI) so as to minimize the errors in measurement. The questionnaire would be considered valid if CVI exceeds 0.7 .
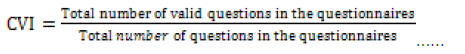 (4.1)
(4.1)
The result revealed that validity value was above cut-off Content Validity Index. This represented high extent of validity and thus questions raised in the questionnaires were minimizing error measurement (Table 5).
| Test | Test t-statistics ᵪ2 calculated =nR2 |
ᵪ2 (5% sig. level) ᵪ 2α(p), where p=xi+1 |
|---|---|---|
| White’s test | 104 | 190.112 |
Table 5: Chi Square calculated and tabulated Chi Square calculated and tabulated.
Test relates to Classical linear regression model Assumptions
In this study diagnostic tests were carried out to ensure that the data fits the basic assumptions of classical linear regression model. Consequently, the results for model misspecification tests are presented as follows. (Table 6)
| Residuals Statisticsa | |||||
|---|---|---|---|---|---|
| Minimum | Maximum | Mean | Std. Deviation | N | |
| Predicted Value | 86.6691 | 89.3012 | 88.0585 | .56528 | 325 |
| Residual | -1.33172 | 1.55301 | .00000 | .54534 | 325 |
| Std. Predicted Value | -2.458 | 2.199 | .000 | 1.000 | 325 |
| Std. Residual | -2.400 | 2.799 | .000 | .983 | 325 |
Table 6: Residuals Statistics.
Also, again confirm that below scatter plot of standardized residuals against predicted values should be a randomly pattern around centered of the line of zero standard residual value providing a relatively even distribution. The points should have the same dispersion about this line over the predicted value range. The dispersion of residuals over the predicted value range between -2.5 and 2.5 looks constant, the predicted values below -2.5 there was too few points to provide evidence against a change in variability. (Table 7)
| Model | Collinearity Statistics | |
|---|---|---|
| Tolerance | VIF | |
| (Constant) | ||
| ESMP | .715 | 1.398 |
| MCOMT | .495 | 2.022 |
| TAUD | .681 | 1.469 |
| TREG | .575 | 1.738 |
| ITS | .562 | 1.779 |
| TCC | .616 | 1.623 |
| TEVA | .659 | 1.518 |
| TAVO | .686 | 1.457 |
| TOT Rate | .607 | 1.648 |
| TKNOW | .679 | 1.473 |
| TFAIR | .861 | 1.162 |
Table 7: Correlation Matrix: Explanatory Variables.
From the above we can see no clear relationship between the residuals and the predicted values which is consistent with the assumption of linearity. This result implies that the homoscedasticity assumptions of the model have been met and thus would be confident about any inference/prediction that we gain from the model.
Test for Normality
Test for normality require checking whether the disturbances are normally distributed or not. Whether the distribution is normal/ or not is one of the basic assumptions in parametric test. As such, if we draw a vertical line through the center of the distribution it displays a mirror image distance on both sides. This kind of distribution is known as a normal distribution and is characterized by the bell-shaped curve. This shape basically implies that the majority of the scores lie around the center of the distribution (so the largest bars on the histogram are all around the central value). The rule that is observed for both skewness and kurtosis and to be considered that the data are normally distributed the range of values need to be from -3 to +3. When the skewness and kurtosis values are in this range, the data distribution is considered normal. (Figure 12)

Figure 12: Normality of residual.
If the residuals are normally distributed around its mean of zero the histogram is a bell shaped. The shape of the histogram as shown above in figure 4.11 revealed that the residuals are normally distributed around its mean of zero. Because without probability sampling, error estimates cannot be constructed.
Linearity
An assumption of multiple linear regression is that the overall independent variables are linearly related to the dependent variable and also that each independent variable is linearly related to the dependent variable. There is a linear relationship between independent variables and dependent variables in this study. (Figure 13)

Figure 13: TOT Performance Residuals P-P Plot.
Similarly, the above figure shows the normal distribution of residuals around its mean of zero. Hence the normality assumption is fulfilled as required based on the above two figures, it is possible to conclude that the inferences that the researcher made about the population parameter from the sample was valid.
Regression Analysis
Descriptive Statistics
Descriptive statistics explains dependent variable turnover tax performance and eleventh independent variables called employee qualification and manpower, management commitment level, taxpayer’s registration, technology and information system, compliance cost, turnover tax rates, tax evasion, tax avoidance, tax audit, tax knowledge and tax fairness. (Table 8)
| N | Minimum | Maximum | Mean | Std. Deviation | |
|---|---|---|---|---|---|
| TOTRP | 325 | 87 | 89 | 88.06 | .785 |
| ESMP | 325 | 1 | 5 | 3.54 | 1.058 |
| MCOMT | 325 | 1 | 5 | 3.52 | 1.382 |
| TREG | 325 | 1 | 5 | 3.65 | 1.000 |
| ITS | 325 | 1 | 5 | 2.91 | 1.154 |
| TCC | 325 | 1 | 5 | 2.87 | .938 |
| TOT Rate | 325 | 1 | 5 | 2.91 | .977 |
| TEVA | 325 | 1 | 5 | 3.92 | 1.152 |
| TAVO | 325 | 1 | 5 | 3.18 | .985 |
| TAUD | 325 | 1 | 5 | 3.53 | .942 |
| TKNOW | 325 | 1 | 5 | 3.54 | 1.021 |
| TFAIR | 325 | 1 | 5 | 3.55 | 1.320 |
| Valid N (list wise) | 325 |
Table 8: Descriptive statistics result.
Correlation Analysis
A Pearson Correlation coefficient was used when we are interested to measure the strength of linear relationship between variables or, to be more precise, how the value of one variable changes when the value of another variable changes. Pearson correlation coefficient ranges from +1 to-1. A correlation of “+1” means that there is a perfect positive linear relationship between variables and a correlation of “-1” means that there is a perfect negative linear relationship between variables. A correlation of “0” means there is no linear relationship between two variables. (Table 9)
| Model | R | R Square | Adjusted R Square | Std. Error of the Estimate |
|---|---|---|---|---|
| 1 | .720a | .518 | .501 | .555 |
Table 9: Model Summary.
Test for Model summary
R2 measures the proportion of variation dependent variable (Y) = (TOTRP), that is explained by explanatory /independent/ variables such as employment qualification and manpower, technology and information system, taxpayer’s registration, tax audit, tax knowledge ,management commitment level, tax fairness ,turnover tax rate, compliance cost, tax evasion tax avoidance or multiple linear regression model. A small value of R2 casts doubt about the usefulness of the regression equation. (Table 10)
| ANOVAa | ||||||
|---|---|---|---|---|---|---|
| Model | Sum of Squares | Df | Mean Square | F | Sig. | |
| 1 | Regression | 103.532 | 11 | 9.412 | 30.573 | .000b |
| Residual | 96.357 | 313 | .308 | |||
| Total | 199.889 | 324 | ||||
| a. | ||||||
Table 10: Analysis of Variance. Analysis of Variance.
The coefficient of determination which was R squared indicates the deviation in the response variable that is as a result of changes in the predictor variable. From the outcome in table 4.12 the value of R square was 0.518, an indication that 51.8 percent of deviations in turnover tax collection are caused by changes explanatory variable. Other variables not included in the model justify for 48.2 percent of the variations in turnover tax collection in revenue authority. Also, the results revealed that there exists strong relationship among the selected independent variables and turnover tax performance as shown by the correlation coefficient(R) equal to 51.8%.
Analysis of Variance (ANOVA)
In order to establish the relationship between employment qualification and manpower, technology and information system, taxpayer’s registration, tax audit, tax knowledge ,management commitment, tax fairness ,turnover tax rate, compliance cost, tax avoidance, tax evasion and turnover tax performance of selected Woredas, eleventh hypotheses was tested using ANOVA. (Table 11)
| Hypothesis | Significant between variables | Significant | Conclusion |
|---|---|---|---|
| HO1 | TOTRP with EQM | YES | REJECT |
| HO2 | TOTRP with MCOM | YES | REJECT |
| HO3 | TOTRP with TREG | YES | REJECT |
| HO4 | TOTRP with ITS | YES | REJECT |
| HO5 | TOTRP with TCC | NO | FAIL TO REJECT |
| HO6 | TOTRP with TOT rate | YES | REJECT |
| HO7 | TOTRP with TEV | YES | REJECT |
| HO8 | TOTRP with TAVO | NO | FAIL TO REJECT |
| HO9 | TOTRP with TAU | YES | REJECT |
| HO10 | TOTRP with TKNOW | YES | REJECT |
| HO11 | TOTRP with TFAIR | YES | REJECT |
Table 11: Result of Tested Hypotheses.
Hypotheses were tested at a significance level of 0.05. In practice, a significance level denoted by α of 0.05 is conventionally used. This is the chosen probability value that forms the boundary between rejecting and not rejecting the null hypothesis. P value on the other hand is the calculated probability which forms the basis of rejecting or accepting the hypothesis. The F critical at 5% level of significance was 0.000. Since F calculated (value = 30.573) is greater than the F critical this shows that the overall model was significant. The significance is less than 0.05, thus indicating that the predictor variables, explain the variation in the dependent variable which is turnover tax performances.
ANOVA (analysis of Variance) also explains the regression by splitting the total sum of squares into regression (explained) sum of squares and error (unexplained) sum of squares. If a regression model is adequate, the explained variance (RSS) should be considerably higher than the unexplained variation (ESS). In the ANOVA table 4.13 the SPSS output illustrates, the total sum of squares (199.889) is split into regression (103.532) and residuals (96.357) which ascertain the condition, F (11,313) =199.889, ρ (0. 000) <α (0. 05).
Multiple Regression Coefficients
In regression model the coefficients of multiple regressions explain the contribution of an individual explanatory variable on the dependent variable. So table 4.14 below summarizes and tests the hypothesis.
The Regression Model Equation
TOT performance = 86.462 + 0.133EQMP +0.146MCOMT + 0.146TREG + 0.142ITS - 0.043TCC + 0.139TRATE - 0.149TEV- 0.036TAVO+ 0.309TAU+ 0.102TKNOW-0.10TFAIR + ε
Discussion of the Findings and Hypothesis test
Effectiveness of Turnover tax administration
H01: There is no significant relationship between Employee qualification and manpower and performance of TOT collection.
Employees qualification and manpower are positively related with performance of TOT collection and have the most statistically significant coefficient at 5% significance level (p-value = 0.000) and as indicated by a t-ratio of 3.873 greater than 2 it is significant. This implies that if the woreda revenue authority administration brings one unit changes in employee’s qualification and manpower than it is now, this will results 0.133 units or 13.3% changes the performance of TOT collection. The effect of employees qualification and manpower is stated by the t-test value = 3.873 which indicates that the effect of employees qualification and manpower is over 3 times that of the error associated with it.
Due to the above evidences that we reject the null hypothesis-1 stated that there is no significant relationship between employee qualification and manpower and performance of TOT collection. These findings implied that authority still needs to add its man power by recruiting knowledgeable and qualified manpower and develop skills of the existing employees through trainings and preparing awareness creation programs to know deep understanding of tax structure and understand tax laws.
This finding agrees with finding of [16] further notes that, financial constraints has led to hiring of tax officials who lack understanding of the tax laws they are administering, and the concepts of accounting that are requisite to analyzing returns. The scholar further posits that, the problem of inexperienced and unqualified personnel is aggravated by lack of training facilities and opportunities. Lastly, [14] argues that, weaknesses in revenue collections occasion inadequate tax collections. Developing countries scholar faces a problem of inefficient tax administration and with insufficient administrative staff with requisite skills, and high level of illiteracy among taxpayers and tax collectors.
H02: There is no significant relationship between management commitment and performance of TOT collection.
Management commitment level are positively related with performance of TOT collection and have the most statistically significant coefficient at 5% significance level (p-value = 0.000) and as indicated by a t-ratio of 4.597 greater than 2 it is significant. This implies that if the woreda revenue authority administration capability brings one unit changes in management commitment level than it is now, this will results 0.146 or 14.6% changes performance of TOT collection. The effect of management commitment level is stated by the t-test value = 4.597 which indicates that the effect of management commitment level is over 4 times that of the error associated with it.
Due to the above implies that we reject the null hypothesis-2 stated that there is no significant relationship between management commitment and performance of TOT collection. This finding suggest that tax offices was slow strategic leadership for implementing TOT policies, not well-motivated plans and feasibility skilled workforce to compete effectively in the area of goal of gaining turnover tax performance. Therefore, there was a serious managerial problem which greatly affected turnover tax collection.
The findings are in agreement with finding of who propose that the top management's principal challenge in the cultural context is to set the culture's tone, pace, and character to see that it's conducive to the strategic changes that the executives are charged with TOT implementing. In fact, this commitment is a prerequisite for TOT implementation, so top managers have to show their dedication to the effort. At the same time, this shows a positive sign for all affected employees. Lastly, where he found out that revenue collection functions are greatly influenced by factors such as, board characteristics’ leadership styles, top management commitment and organizational structure.
H03: There is no significant relationship between taxpayer’s registration and performance of TOT collection.
Taxpayer’s registrations are positively related with performance of TOT collection and have the most statistically significant coefficient at 5% significance level (p-value = 0.000) and as indicated by a t-ratio of 3.968 greater than 2 it is significant. This implies that if the Woreda revenue authority administration capabilities brings one unit changes in taxpayer’s registrations than it is now, this will result in 0.161 units or 16.1% changes the performance of TOT collection. The effect of taxpayer’s registrations is stated by the t-test value 3.968 which indicates that the effect of taxpayer’s registrations is over 3 times that of the error associated with it. Due to the above evidences that we reject the null hypothesis-3 stated that there is no significant relationship between taxpayer’s registrations and performance TOT collection.
This findings implies that taxpayers registration was inadequate to effective revise their number every year which results comes from taxpayers record and submit their book improper on timely for registration, taxpayers undervalue their turnover, need of knowledge (awareness) of the business community about the time, ways and reasons of registering for TOT, the exaggerated TOT rules imposed on the taxpayers, the inconsistent TOT registration system followed by the authority.
This finding was support the finding of [20] that a significant number of businesses also fail to register or file tax declarations. This only increases the burden on those taxpayers who try to comply with the tax law, and discourages their future compliance. Similarly agree the finding of [21] argued that inadequate tax payers’ registrations are the most important factor to affects the collection procedure and revenue collection performance. Lastly, this concurs with the finding of Bitarabeho noted that lack of tax registration was high in developing countries and was one of the factors hampering revenue collection.
H04: There is no significant relationship between Technological and information system and performance of TOT collection.
Technology and information system are positively related with performance of TOT collection and have the most statistically significant coefficient at 5% significance level (p-value = 0.000) and as indicated by a t-ratio of 3.981 greater than 2 it is significant.
This implies that if the woreda revenue authority administration capability of technology and information system by a one unit change than it is now, this will changes the performance of TOT collection by 0.142 units or 14.2%. The effect of technology and information system is stated by the t-test value = 3.981 which indicates that the effects of technology and information system is over 3 times that of the error associated with it. Due to the above evidences that we reject the null hypothesis-4 stated that there is no significant relationship between technological and information system and performance of TOT collection.
These findings implied that there is no effective control manipulation of the cash register machines when purchasing and sales good and services. Thus provide a mistaken check of gross sales. The TOT registrant was sale goods and services without tax invoices. As a result the office was not able to collect the potential tax which they can generate from turnover tax.
These findings validated finding by where he found out that the state of ICT infrastructure in the country determines how revenue collection systems are implemented and used by customers and this affects revenue collection. These findings were similar with finding of who stated that essentially computerization of all processes among others reduces errors and enables consistency in operations reducing operational costs in revenue collections.
H05: There is no significant relationship between Compliance cost and performance of TOT collection.
Tax Compliance Cost are negatively related with performance of TOT collection and have statistically insignificant coefficient at 5% significance level (p-value = 0.301) and as indicated by a t-ratio of 1.035 less than 2 it is insignificant. This implies that if the Woreda revenue authority administration capabilities of tax compliance cost by one unit negatively decrease than it is now, this will increase performance of TOT collection by 0.043 units or 4.3%. The effect of tax compliance cost was stated by the t-test value =1.035 which implies that the standard error associated with the parameter is greater than the effect of the parameter. Due to the above evidences that we fail to reject the null hypothesis-5 stated that there is no significant relationship between compliance cost and performance of TOT collection.
This findings show that fair compliance cost can results in reduce tax avoidance ,tax fraud and inhibits investment by way of retreating competitiveness of the country in terms of taxation attractiveness thus tax authorities are interested in making the tax legislations simpler. The study felt that consultancy charges, filing tax returns on tax computation and cost of hiring tax agents, cost of compliance incurred by experience revenue authority are fair not high.
This finding contradict the finding of that compliance cost is one of the three elements of social costs of taxation which are incurred when purchasing power is transferred from the taxpayers to the government. In addition to argue compliance costs include costs that are incurred by a company, but are beyond the control of its management hence tax compliance cost is likely to affect tax collection performance.
Enforcement of TOT law and regulation on TOT performance
H06: There is no significant relationship between Turnover tax rate and performance of TOT collection.
Turnover tax rates are positively related with performance of TOT collection and have the most statistically significant coefficient at 5% significance level (p-value = 0.001) and as indicated by a t-ratio of 3.424 greater than 2 it is significant.
This implies that if the Woreda revenue authority enforces turnover tax rates by a one unit increase than it is now, this will increase the performance of TOT collection by 0.139 units or 13.9%. The result of turnover tax rates is stated by the t-test value = 3.424 which indicates that the effects of turnover tax rates is over 3 times that of the error associated with it.
Due to the above evidences that we reject the null hypothesis-6 stated that there is no significant relationship between turnover tax rates and performance of TOT collection. This finding show that turnover tax rates have been established as crucial factors in turnover tax collection performance. Tax rates can discourage compliance in which too high rate and higher than profit margins including not based on the ability-to-pay principle and perceived unfair by taxpayers. Tax rates scare businesses and influence the purchasing trends of the people. As a result, by increasing tax rates, there is no given certainty that there will be more revenue generation.
This finding confirms the finding of [27] also identified tax rates as one of the causes of tax evasion. He pointed out that a higher tax rate increases taxpayers’ burden and reduces their disposable income therefore, the probability of evading tax is higher. Also this finding agree the finding of conducted a study to determine factors affecting tax compliance by SMEs in Central North of Nigeria and found that high tax rates and complex filing procedures are the most for causing noncompliance of SMEs. The primary factor they established was the high tax rates being charged by tax authorities, who agrees with the results found in this study.
H07: There is no significant relationship between tax evasion and performance of TOT collection.
Tax evasion is a negatively relationship to performance of TOT collection and have the most statistically significant coefficient at 5% significance level (p-value = 0.000) and as indicated by a t-ratio of 4.514 greater than 2 it is significant. This implies that if the woreda revenue authorities enforce tax evasion by a one unit increase than it is now, this will decrease the performance of TOT collection by 0.149 units or 14.9%. The effect of tax evasion is stated by the t-test value = 4.514 which indicates that the effect of tax evasion is over 4 times that of the error associated with it. Due to the above evidences that we reject the null hypothesis-7 stated that there is no significant relationship between tax evasion and performance of TOT collection. The study showed that law enforcement is not implemented in the way that honesty taxpayers are encouraged and hence tax evasion is persistent features many businessmen.
The results tax evasion strongly affects TOT collection during the study period, because as revenue officers increasing her targeted revenue by increase tax rates. This was encouraging taxpayer to evade taxes, and results to revenue loss. Therefore tax evasion has negatively affecting of turnover tax collection performance.
As an interview from tax officers indicate that;
This finding supports the finding of found that tax evasion has negative impact on the level of tax collection performance. He argued that the countries with high rate of tax evasion also has low rate of revenue collection and vice versa. Lastly, this finding agrees with the findings of who found that turnover tax suffered from tax evasion and illegal practices like reduction of deductions and collusion.
H08: There is no significant relationship between tax avoidance and performance of TOT collection.
Tax Avoidance are negatively related with performance of TOT collection and have the statistically insignificant coefficient at 5% significance level (p-value = 0.339), the p value is higher than 0.05 and as indicated by a t-ratio of 0.957 less than 2 it is insignificant. This implies that if the Woreda revenue authority enforces tax Avoidance by one unit negatively decrease than it is now this will increase performance of TOT collection by 0.036 units or 3.6%. Due to the above evidences that we fail to reject the null hypothesis-8 stated that there is no significant relationship between tax avoidance and performance of TOT collection.
H09: There is no significant relationship between tax audit and performance of TOT collection.
Tax Audit are positively related to with performance of TOT collection and have the most statistically significant coefficient at 5% significance level (p-value = 0.000) and as indicated by a t-ratio of 7.799 greater than 2 it is significant. This implies that if the Woreda revenue authority enforces tax Audit by one unit change than it is now, this will changes the performance of TOT collection by 0.309 units or 30.9%. The result of tax audit is stated by the t-test value = 7.799 which indicates that the effect of tax audit is over 7 times that of the error associated with it. Due to the above evidences that we reject the null hypothesis-9 stated that there is no significant relationship between tax audit and performance of TOT collection.
This finding suggested that tax audit for tax payers is once a year. Thus, the probability of tax payers to evade tax is high because of an investigation by the tax office is low frequent advised new registered taxpayers concerning filing of returns, payment of amount due, records to be maintained as well as insufficient staff trained well.
This finding agrees the finding of when they came to find out the revenue collection efficiency is determined by the probability of audit and by the penalty on underpaying. This finding exemplified by conducted a study to the effect of Tax Audit on Tax Compliance in Nigeria. He revealed out that tax authority employed tax audit towards achieving target revenue, tax payers do not usually cooperated with tax audit personnel during the exercise of field audit.
Attitude towards payment of tax on turnover tax performance
H010: There is no significant relationship between tax knowledge and performance of TOT collection.
Tax knowledge are positively related to performance of TOT collection and have the most statistically significant coefficient at 5% significance level (p-value = 0.000) and as indicated by a t-ratio of 2.773 greater than 2 it is significant. This implies that if the woreda revenue authority of tax knowledge by one unit change than it is now, this will change the performance of TOT collection by 0.102 units or 10.2%. The effect of tax knowledge is stated by the t-test value = 2.773 which indicates that the effect of tax knowledge is over 2 times that of the error associated with it. Due to the above evidences that we reject the null hypothesis-10 stated that there is no significant relationship between tax knowledge and performance of TOT collection. This finding suggested that taxpayers didn’t have adequate training of tax knowledge in their environment for payment of tax.
This in turn creates taxpayers undermine the volume of the sales. In addition to taxpayers considering of tax as a harm & not taking it as an absolute duty of citizens, postponing and reduce tax liability which is detrimental to the countries development, and not feeling of guilty when tax laws are broken.
This finding agrees the finding of which states that the aspect of tax knowledge for taxpayers greatly affects the taxpayer's attitude to the tax system fair. And will also affect the tax revenue received by the condition if the people already have low tax knowledge.
H011: There is no significant relationship between tax fairness and performance of TOT collection.
Tax fairness are negatively related with performance of TOT collection and have the most statistically significant coefficient at 5% significance level (p-value = 0. .006) and as indicated by a t-ratio of 3.988 greater than 2 it is significant. This implies that if the woreda revenue authority of tax fairness by one unit change than it is now, this will changes the performance of TOT collection by 0.100 units or 10%. The result of tax fairness is stated by the t-test value = 3.988 which indicates that the effects of tax fairness over 3 times that of the error associated with it. Due to the above evidences that we reject the null hypothesis-11 stated that there is no significant relationship between tax fairness and performance of TOT collection.
Both tax authority and taxpayers accepts as true that fairness in tax system, assessment and collection procedures is one of the factors affecting turnover tax collection performance. Taxpayers think that tax system is unfair if their perception towards what they receive from government less than what they pay as tax.
This finding contradict the finding of further indicates that a well-functioning tax administration, perceived as treating all taxpayers fairly and with respect, and concerned with collecting only the proper amount of tax, will go a long way towards achieving the goal of voluntary compliance which benefits everyone.
Conclusion and Recommendation
According to revenue authority of selected Woredas, there is a substantial tax gap between the tax that is theoretically assumed to be collectable from economically active individual’s taxpayers in the Woreda and the turnover tax that is actually being collected. This study was aimed factors affecting turnover tax collection performance revenue authority of selected Woredas.
Employee qualification and manpower are key factor against which an efficient tax administration needs to strengthen by qualification and training its employees to understanding of the entire system of turnover tax. The regression output in this study supported the positive relation between employee qualification and manpower and performance of TOT collection with ρ- value 0.000 which is < α-value (0.05), r value is 0.462 which shows the strength of correlation, β1 =0.133 which shows the variation /change/ in performance of TOT collection due to a unit change in employee qualification and manpower.
The management commitment is vital in the implementation of the TOT collection program. The regression output in this study supported the positive relation between management commitment level and performance of TOT collection with ρ- value 0.000 which is < α-value (0.05), r value is 0.414 which shows the strength of correlation, β2 =0.146 which shows the variation / change/ in performance of TOT collection due to a unit change in management commitment level.
Taxpayers registrations was a method to identify effectively to assessment and collection procedures for registering all potential taxpayers without intervention of tax officials, but there is inadequate registration was a challenges for turnover tax collection in study area. The regression output in this study supported the positive relation between tax registrations and performance of TOT collection with ρ- value 0.000 which is < α-value (0.05), r value is 0.449 which shows the strength of correlation, β3 =0.161 which shows the variation /change/ in performance of TOT collection due to a unit change in tax registrations.
Technology and information system is very important to local authorities. This is because less usage of computerized Information Systems especially less usage of electronic tax register machines had effect on revenue collection positively. The regression output in this study supported the positive relation between technology and information system and performance of TOT collection with ρ- value 0.000 which is >α-value (0.05), r value is 0.454 which shows the strength of correlation, β5 =0.142 which shows the variation / change/ in performance of TOT collection due to a unit change in technology and information system.
Tax Compliance Cost could insignificant effect on performance of TOT collection, and an indication of its magnitude effect. It was deduced that tax compliance cost has a profound effect on turnover tax collection. These findings suggest tax systems with fair tax compliance costs are most likely complied with increase the payments and filing of taxes, hence leading to high rates of tax collection performance. Therefore, the tax compliance cost should be in a way that does not encourage taxpayers to avoid tax.
The regression output in this study supported the negative relation between tax compliance cost and TOT performance with ρ- value 0.301 which is > α-value (0.05), r value is -0.232 which shows the weak correlation, β11 = -0.043 which shows there is no variation / change/ in performance of TOT collection due to a unit change in tax compliance cost. This means that compliance costs did not affect performance of TOT collection.
High turnover tax rates do not necessarily increase tax collection but can likely lead to tax evasion. In general, the study concluded that tax rates to a large extent affect revenue collection in selected woreda. The regression output in this study supported the positive relation between turnover tax rate and TOT performance with ρ- value 0.001 which is < α-value (0.05), r value is 0.361 which shows the strength of correlation, β6 =0.139 which shows the variation / change/ in performance of TOT collection due to a unit change in turnover tax rate.
Tax evasion is the most severe factors followed by bureaucratic corruption. These factors occur most of the time in indirect taxes such as turnover tax. The regression output in this study supported the negative relation between tax evasion and TOT performance with ρ- value 0.000 which is < α-value (0.05), r value is -0.545 which shows the strength of correlation, β7 = -0.149 which shows the decreasing in performance of TOT collection due to a unit increasing in tax evasion.
Tax avoidance was the regression output in this study supported the negative relation between tax avoidance and TOT performance with ρ- value 0.339 which is >α-value (0.05), r value is -0.371 which shows the strength of correlation, β8 =-0.036 which shows there was increase TOT performance due to a unit change in tax avoidance decrease.
Tax audit are conducted to verify if the taxpayer has correctly reported by taxpayers and identify tax evaders, but taxpayers do not cooperating to give essential information necessary for performing field audit. As a result inadequate tax audit conducted which less revenue was collected. The regression output in this study supported the positive relation between tax audit and performance of TOT collection with ρ- value 0.000 which is < α-value (0.05), r value is 0.515 which shows the strength of correlation, β9 =0.309 which shows the variation /change/ in performance of TOT collection due to a unit change in tax audit.
Tax knowledge is a cornerstone attitude of taxpayers towards tax payment and it is impossible to imagine about an effective turnover tax collection where there is inadequate knowledge of taxpayers. The regression output in this study supported the positive relation between tax knowledge and TOT performance with ρ- value 0.006 which is < α-value (0.05), r value is 0.348 which shows the strength of correlation, β10 =0.102 which shows the variation /change/ in performance of TOT collection due to a unit change in tax knowledge.
Tax fairness show that individuals having equal income are paying equal tax but in study area there was no fair income distribution among taxpayers. This result highly affects the taxpayers’ motivation to be compliant and reduce tax performance. The regression output in this study supported the negative relation between tax fairness and TOT performance with ρ- value 0.000 which is < α-value (0.05), r value is -0.472 which shows the strength of correlation, β4 = -0.100 which shows the variation /change/ in performance of TOT collection due to a unit change in tax fairness.
Recommendation
Revenue authority of selected Woredas needs to continually review its systems, strategies and skills to keep pace with the problem of violations of tax law. These findings from both factor analysis and inferential statistics in this study showed that plenty issues to be given respective attention from woreda revenues office and stakeholders, zone revenue office. That is why study suggests the following:
Tax officer’s needs to strengthen itself by recruiting qualified manpower by using continuous clarification & training employers and adequate manpower about tax collection by allocating enough money to training center.
Managements should ensure them commitment level effective policy implementation and motivated staff’s employees by financial incentives to encouraged TOT collection commitment. The management office should work towards bringing the team spirit by solving internal layers of management problem with its attendant bureaucracy.
Revenue authority ensures the updating of a taxpayer’s registration information whenever changes occur in the status of the taxpayer particularly in changes in contacts and location. Simplifying the registration of businesses and effective door- to- door inspection and provide an accurate register cleanup of all taxpayers up to date.
This enables to select non-filers or stop filers automatically and used to tackle fraud.
It should effectively make use of ITS facilities on tax administration and to train tax officials to use the SIGTAS properly. Tax officials effectively control taxpayers manipulate cash register machines and many TOT registrants provide fake invoices to secure more input tax. Using ETRs reduces time and money of tax payers and also reduces evasion.
Regarding turnover tax rates, the government should fixed the tax rates to increase voluntary compliance by tax payers since they do not feel over-burdened by taxes.
Revenue officers should be made by government at sensitizing population on the seriousness of tax evasion attached to tax violators. Simplify the tax code, making clearer the distinction between lawful and unlawful behavior. Also increase enforcement tax laws and make the level of enforcement more uniform.
Revenue authority was to ensure accuracy in the TOT returns by audited frequency with taxpayers more than one in a year to reduce the chances of taxpayers to evade tax. The authority should have audit plan based on risk assessment and door to door inspection to check inventories for field auditing. The Audit unit of the tax authority should be strengthened to always audit tax remittance by collectors at all levels which results to curb corrupt practices among tax officials.
Revenue Officers have to carry out taxpayer’s education center so as to uplift the level of public awareness on paying TOT. They identify, train and support volunteers to educate taxpayers in complying with tax obligations. This was results paying and filing their returns as required and on time. Awareness creation should participated influential groups in the society (elderly, religious leaders, prominent personalities).
Tax Fairness was an equal treatment of taxpayers with in the same income brackets equally, transparency of revenue office, unbiased tax assessor committee, and trusts in tax systems are elements to mention few. So the revenue office is advised to treat all taxpayers fairly and equitably so that the current tax system should not affect the compliance attitudes of taxpayers.
Recommendations for Future Research
This study has highlighted the factors affecting turnover tax collections performance. The study had determined persistent factors that hinder the Revenue Authority failure to raise adequate from TOT for economic and social developments. We recommend that further research is required in Revenue Authority to know factors that affect the quality service, politico legal factors, accountability and transparency and tax noncompliance.
REFERENCES
- McCluskey WJ, Franzsen RC. Land value taxation: An applied analysis 2017.
- Fjeldstad OH. To pay or not to pay? Citizens' views on taxation 2004.
- Hassan M. Turnover tax: Perhaps it has some benefits? Turnover-based taxation 2009; 281:7-8.
- Shapiro JUK. Tax Law Changes and Impact on U.S. Taxpayers 2014.
- Ngungi KM. A survey of internal controls system among the listed private and Public sector companies 2011.
- Simiyu D. Challenges affecting collection of turnover tax 2010.
- Dave NM. Factors influencing Turnover Tax Compliance 2014.
- ERCA. Revenue development tax forum conducted Addis Ababa report 2018.
- Fleurbaey M, Maniquet F. Optimal income taxation theory and principles of fairness. Journal of Economic Literature. 2018; 56:1029-1079.
- Kirchler E, Muehlbacher S, Kastlunger B, Wahl I. Why pay taxes? A review of tax compliance decisions. Developing alternative frameworks for explaining tax compliance. Journal of Economic Psychology 2010; 29:210-225.
- Bird RM. Improving Tax administration in Developing Countries. Journal of Tax Administration 2015; 1:23-45.
- Schlimgen JR. Virtual world, real taxes: A sales and use tax adventure through Second Life starring Dwight Schrute. Minn JL Sci & Tech 2010; 11:877.
- Kasipillai J, Aripin N, Amran NA. The influence of education on tax avoidance and tax evasion. Journal of tax Research 2005; 1:134-146.
- Atawodi OW, Ojeka S. Factors that affect tax compliance among small and medium enterprises (SMEs) in North Central Nigeria. International journal of business and management. 2012; 7:45-50.
- Allingham MG, Sandmo A. Income tax evasion: A theoretical analysis. Taxation: critical perspectives on the world economy 1972; 3:323-338.
- Cobham A. Tax evasion, tax avoidance and development finance 2015; 129:1-20.
- Onoja ML, Iwarere TH. Effects of tax audit on revenue generation: Federal Inland Revenue service, Abuja experience. Journal of Good Governance and Sustainable Development in Africa (JGGSDA). 2015; 2:67-80.
- Palil M and Mustafa F. Tax knowledge and tax compliance determinants in self-assessment system in Malaysia. Africa journal of Business Management 2011; 5:12884-12872.
- Chan CW, Troutman CS, O’Bryan D. An expanded model of taxpayer compliance: Empirical evidence from the United States and Hong Kong. Journal of International Accounting, Auditing and Taxation. 2000; 9:83-103.
- Asrinanda YD. The effect of tax knowledge, self-assessment system, and tax awareness on taxpayer compliance. International Journal of Academic Research in Business and Social Sciences 2018; 8:539-550.
- Simon James & Clinton Alley. Tax Compliance, self-assessment and tax administration. Journal of Finance and Management in Public Services. 2004; 2:27-42.
- Abiola J, Asiweh M. Impact of Tax administration on Government Abiola J, Asiweh M. Impact of tax administration on government revenue. International Journal of business and social science. 2012; 3:99-113.
- Fanos Mekonnen. Zonal diagnosis and intervention plan 2012.
- Hutcheson, G. Ordinary Least-Squares Regression: 2011; 224-228.
- Mugo P. Benefits automated revenue administration. Journal of finance 2016; 24:125-130.
- Karimi H, Maina KE, Kinyua JM. Effect of technology and information systems on revenue .International Academic Journal of Procurement and Supply 2016; 1:1-26.
- Slemrod J, Yitzhaki S. The costs of taxation and the marginal efficiency cost of funds 2009; 43:172-198.
- Aizenman J, Jinjarak Y. The collection efficiency of the Value Added Tax: Theory and international evidence. Journal of International Trade and Economic Development. 2008; 17:391-410.
- Abdul-Jabbar H, Pope J. Exploring the relationship between tax compliance costs and compliance issues in Malaysia. Journal of Applied Law and Policy 2008; 2:1-20.
- Sweet man D, Badiee M, Creswell JW. Use of the transformative framework in mixed methods studies. 2010; 16:441-454.
- Mohani A, Sheehan P. Estimating the extent of income tax non-compliance 2004; 1:20-24.
- Marti LO, Wanjohi MS, Magutu O. Taxpayers’ attitudes and tax compliance behaviour in Kenya. African Journal of Business & Management. 2010; 1:112-122.
- Rego SO. Tax‐avoidance activities of US multinational corporations. Contemporary Accounting Research 2003; 20:805-833.
- Bayu T. Analysis of tax buoyancy and its determinants in Ethiopia (cointegration approach). Journal of Economics and Sustainable Development. 2015; 6:4-12.
Citation: Kibret DD (2021) Factors Affecting Turnover tax Collection Performance: A Case of West Shoa Selected Woredas. Int J Account Res 9:214.
Copyright: © 2021 Kibret DD. This is an open-access article distributed under the terms of the Creative Commons Attribution License, which permits unrestricted use, distribution, and reproduction in any medium, provided the original author and source are credited.