
Indexed In
- Open J Gate
- Genamics JournalSeek
- Academic Keys
- JournalTOCs
- RefSeek
- Hamdard University
- EBSCO A-Z
- SWB online catalog
- Publons
- Geneva Foundation for Medical Education and Research
- Euro Pub
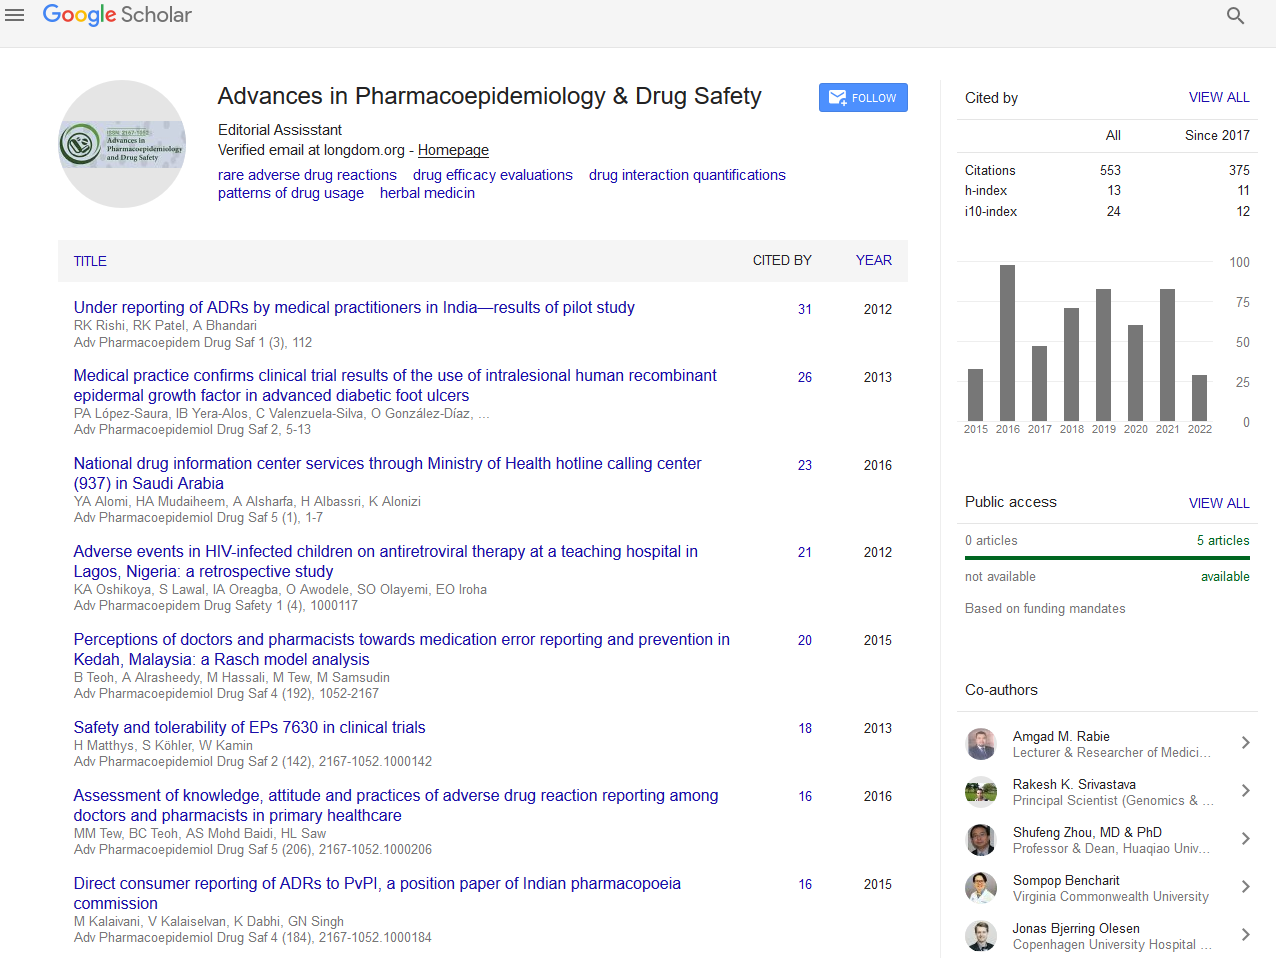
- Google Scholar
Useful Links
Share This Page
Journal Flyer
Open Access Journals
- Agri and Aquaculture
- Biochemistry
- Bioinformatics & Systems Biology
- Business & Management
- Chemistry
- Clinical Sciences
- Engineering
- Food & Nutrition
- General Science
- Genetics & Molecular Biology
- Immunology & Microbiology
- Medical Sciences
- Neuroscience & Psychology
- Nursing & Health Care
- Pharmaceutical Sciences
Research - (2020) Volume 9, Issue 2
Evaluation of Pattern of Drug Use in Tertiary Health Care Setting in Central Tigray Using WHO Prescribing Indicators
Gebremicheal Gebreslassie Kasahun1*, Gebre Teklemariam Demoz2, Amha Teklu Asayehegn3, Leake Gebremeskel Gebrehiwot4, Goitom Mengstu Tesfay2 and Desilu Mahari Desta52Clinical Pharmacy Unit, Aksum University, Aksum, Tigray, Ethiopia
3Pharmaceutical Chemistry and Quality Control Unit, Aksum University, Aksum, Tigray, Ethiopia
4Pharmacology and Toxicology Unit, Aksum University, Aksum, Tigray, Ethiopia
5Clinical Pharmacy Unit, Mekelle University, Mekelle, Tigray, Ethiopia
Received: 11-Jun-2020 Published: 04-Aug-2020, DOI: 10.35248/2167-1052.20.9.226
Abstract
Background: Rational drug use entails a multi-collaborative effort which encompasses various professionals. Prescribing indicator is among the WHO core drug use indicators used to investigate the rational drug use in healthcare facilities. The study was aimed to evaluate drug utilization pattern using WHO prescribing indicators in Aksum University Comprehensive Specialized Hospital (AkUCSH).
Methods: A facility based cross sectional study design was employed which was conducted between April and May 2019. Records of patients at Out-patient Pharmacy administered from April 01 2018 to March 31 2019 were the study populations. Based on WHO recommendation, a total of 600 patient prescriptions were included. A systematic random sampling technique was employed to include patient prescriptions fulfilled the inclusion criteria. A structured data collection tool was used to collect data and necessary supervision was done during the data collection process. Data was entered in to, checked, and analyzed using Statistical Package for Social Science (SPSS) version 24.
Results: Totally, 1053 drugs were prescribed in 600 prescriptions. The average number of drug prescribed per encounter was found to be 1.78 (SD ± 0.913). Encounters prescribed using generic name were 95.63% (1007). Moreover, about 99.5% (1048) prescribed medicines were within the Essential Medicines List (EML). In this study from a total of 1053 prescribed medicines, 49.2% (295) and 4.0% (24) were antibiotics and injections, respectively.
Conclusion: Our finding revealed, the pattern of rational drug use using WHO prescribing indicators is suboptimal.
Keywords
Drug use; Prescribing indicator; Antibiotics; Injections; Ethiopia
Abbreviations and Acronyms
AkUCSH: Aksum University Comprehensive Specialized Hospital; EML: Essential Medicines List; RDU: Rational Drug Use; WHO: World Health Organization
Introduction
Drugs are the main intervention mechanisms used for the treatment, diagnosis, mitigation and prevention of diseases [1]. Therefore, rational way of drug use needs to be always in the forefront practice. The World Health Organization (WHO) defined, Rational Drug Use (RDU) is when patients receive medications appropriate for their clinical needs, in doses that meet their own individual requirements, for an adequate period of time, and the lowest cost to them and their community [2-4]. The ultimate goal of RDU is to foster better quality of pharmaceutical care, to minimize the cost of drug therapy, to avoid preventable adverse drug reactions and drug interactions, to maximize therapeutic outcomes and to promote patient adherence [5,6].
In contrast to this, the use of drugs when no drug therapy is indicated, the use of the wrong drug for a specific condition requiring drug therapy, the use of drugs with doubtful or unproven efficacy, the use of drugs of uncertain safety status, failure to provide available, safe, and effective drugs, the use of correct drugs with incorrect administration, dosages, and duration, the use of unnecessarily expensive drugs is deemed as irrational use of drugs [7,8]. Overuse of antibiotics and indiscriminate use of injections are some of the common encounters of inappropriate prescribing practice in many health care facilities [7,9].
Although higher level of medical knowledge was associated with a higher percentage of drugs prescribed from the Essential Medicines List (EML) prescriber differences in final academic degree and specialty leads to differences in all of the five prescriptions quality indicators [10-12].
Though, there is a dearth of information on the pattern of rational drug use in our setting. Therefore, the study was aimed to evaluate the rational drug utilization pattern using WHO prescribing indicators in Aksum University Comprehensive Specialized Hospital (AkUCSH).
Methods
Study setting, area and design
A facility based cross sectional study design was employed to evaluate the drug utilization pattern using WHO prescribing indicators in AkUCSH. It is a tertiary healthcare hospital located in central Tigray in the northern part of Ethiopia. It is considered to provide a diagnosis, treatment and rehabilitation services for a population of more than 3.5 million. The pharmaceutical service is organized as Out-patient Pharmacy Department, Inpatient Pharmacy Department, Emergency Pharmacy Department, Operation room pharmacy, and Central store. The study was conducted between April and May 2019.
Study population and sampling procedure
Records of patients at Out-patient Pharmacy administered from April 01 2018 to March 31 2019 were the study populations. Prescriptions containing only medical supplies like syringe and gloves were excluded. These were selected based on WHO [13] recommendation and a total of 600 encounters were included. A systematic random sampling strategy was employed to include the predetermined sample. Therefore, every eighth prescription was included among 4782 prescriptions prescribed in the review period until the predetermined sample was obtained.
Data collection and management
A data collection tool was used adopted by WHO [13] to collect the data. This data collection format was completed by trained data collectors. Strict and necessary supervision and checking was done to ensure completeness and consistency of data during the data collection process. Data was entered in to, checked, and analyzed using Statistical Package for Social Science version 24.
Measurements
Prescribing indicator is one of the WHO core drug use indicators which help to assess the rational drug use in health care facilities. It includes various indicators to assess the prescribing pattern. In our study it is used to assess the pattern of rational drug use as follows [13].
Indicator 1: Average number of drugs per encounter
It indicates the average number of drugs per prescription to measure the degree of poly pharmacy. It is calculated by dividing the total number of drug products prescribed, by the number of prescriptions surveyed. It is not relevant whether the patient actually received the drugs.
Indicator 2: Percentage of drugs prescribed by generic name This measures percentage of drugs prescribed by generic name and its purpose is to measure the tendency to prescribe by generic name. It is calculated as dividing the number of drugs prescribed by generic name by the total number of drugs prescribed, multiplied by 100.
Indicator 3: Percentage of encounters with an antibiotic prescribed
It is to measure the percentage of prescriptions with antibiotics and to assess the overall use of antibiotics. This is calculated by dividing the number of patient encounters during which an antibiotic was prescribed, by the total number of prescriptions surveyed, multiplied by 100.
Indicator 4: Percentage of encounters with an injection prescribed It is to measure the percentage of prescriptions with injections and to assess the overall prescribing of injections. This is calculated by dividing the number of patient encounters during which an injection was prescribed, by the total number of prescriptions surveyed, multiplied by 100.
Indicator 5: Percentage of drugs prescribed from the essential drug list or formulary
This is to measure the degree to which prescribing practices follow to the National EML [14]. It is calculated by dividing the number of drugs prescribed which are listed on the essential drugs list or local formulary, by the total number of drugs prescribed, multiplied by 100.
Results
In the one-year review period, from a total of 600 systematically randomly selected prescriptions 1053 drugs were prescribed. Majority of the encounters (44.3%) were contained one medicine per encounter followed by two medicines per encounter. The average number of drugs prescribed per encounter was found to be 1.78 (SD±0.913), and ranging from one to seven medicines per encounter Table 1.
Table 1: Number of drugs prescribed per encounter in AkUCSH Ethiopia, 2019.
| S.no. | n = number of drugs per encounter | Frequency (x*n) | Percentage (%) |
|---|---|---|---|
| 1. | One | 266*1 | 44.3 |
| 2. | Two | 240*2 | 40.0 |
| 3. | Three | 66*3 | 11.0 |
| 4. | Four | 19*4 | 3.2 |
| 5. | Five | 6*5 | 1.0 |
| 6. | Six | 1*6 | .2 |
| 7. | Seven and above | 2*7 | .3 |
| Total | 1053 | 100.0 |
The encounters prescribed using generic name was found to be 95.63% (1007). Moreover, most (99.5%, n=1048) prescribed medicines were found to be in the EML of Ethiopia. Furthermore, our study indicated from a total of 1053 prescribed medicines, 49.2% (295) were antibiotics. Almost one half of the overall prescription was limited to antibiotic prescription. Furthermore, the encounter containing injections were found to be 4.0% (24). In the medical outpatient pharmacy, the overall prescriptions with injections were very small Table 2.
Table 2: WHO prescribing indicators-based drug use pattern in AkUCSH Ethiopia, 2019.
| S.no | Prescribing indicator | No of drugs (n) | Percentage (%) | Standard [13] |
|---|---|---|---|---|
| 1. | Average no of drugs per encounter | Mean (SD)=1.78 (0.913), Range=1-7 | - | 1.6-1.8 |
| 2. | Prescriptions with only one drug prescribed | 266 | 44.3 | - |
| 3. | Prescriptions with five or more drugs prescribed (poly pharmacy) |
9 | 1.5 | - |
| 4. | Prescriptions with injection drugs prescribed | 24 | 4.0 | 13.4- 24.1 |
| 5. | Prescriptions with antibiotics prescribed | 295 | 49.2 | 20.0-26.8 |
| 6. | Drugs prescribed by generic name | 1007 | 95.63 | 100 |
| 7. | Drugs included in the EML | 1048 | 99.5 | 100 |
EML: Essential Medicines List
Discussion
The present study found; the average number of medicines prescribed per encounter was found to be 1.78. Earlier study conducted in Southern Ethiopia reported comparable finding (1.77) [15]. This was with the WHO recommended range (1.6- 1.8) [13], but lower compared to other studies; (1.84-2.93) [16-21]. Our finding revealed there was a minimum tendency of polypharmacy. Only nine prescriptions were prescribed with five and above medicines. This might be due to prescriber’s experience, lower comorbid conditions and increased hospital visit as the commencement of community-based health insurance. The percentage of drugs prescribed in generic name was accounted to 95.63% (1007). Although majority of these medicines were prescribed by their generic name this was slightly lower to the acceptable level. In line to this study, a study conducted by Birhanu et al. [16] reported comparable finding (93.3%). Prescriber experience and different professional and nonprofessional trainings might be the plausible explanations. However, this necessitates an extra effort from professionals, regulatory bodies and other responsible organizations.
Our study found, the encounters with antibiotic prescription were 49.2%. This was very high as compared to the ideal range (20.0-26.8) [13]. Similar to our study, other studies also reported prescriptions with antibiotics were higher compared to other group of medicines; (31.8-65.4%) [18,22-24]. This overuse of antibiotics might result the emergence of antimicrobial resistance and can force patients to demand unnecessary expenditure which in return leads to reduced access and attendance rates due to medicine stock-outs and loss of patient confidence in the health care system [7,25-27]. In contrary to this, other studies reported a lower level of antibiotic prescription (6.6-17.7%) [17,20]. This might be due to the difference in type of the population and prevalence of infectious disease conditions in the study area.
Consistent to other studies (8.1-10.9%) [19,20], our study revealed, a few percent of injectable drugs 4% (24) were prescribed. This could be due to the outpatient pharmacy is mainly organized for ambulatory clients while patients with severe and emergent conditions are served in other pharmacy dispensing areas. The national EML is considered to contain medicines with higher public health relevance, optimum safety, efficacy and quality and reasonable cost. Health care facilities procure medicines based on EML and required to develop their own hospital formulary [28]. In the present study, almost all medicines 99.5% (1048) were from the national EML. This was concurrent with other studies conducted in Ethiopia; 99.3% [17], and 100% [18]. This might be due to prescriber’s experience, type of disease conditions and nature of medicines procured.
Limitation of the Study
As with any study this study might not without limitations. First, our findings could not be generalized for the whole Ethiopia and should not be extrapolated to the international world. Secondly, the nature of the study design and data collection technique might introduce information bias, other studies might be necessary to assess the types of medications frequently prescribed, common disease conditions, and prescriber’s experience and qualification for further recommendations. Our finding might however add to the growing literature, particularly around rational drug use and pharmaceutical health systems in developing countries.
Conclusion
Our finding revealed, the pattern of rational drug use using WHO prescribing indicators were suboptimal. The number of antibiotics and injections per encounter were beyond. However, the average number of drugs per encounter was within the recommended range and nearly all these drugs were from EML.
Acknowledgments
We would like to thank the data collectors and the hospital staff for their genuine support during the study.
Conflict of Interest
The authors declare that they have no any conflicts of interest.
REFERENCES
- Ofori-Asenso R, Agyeman A. Irrational use of medicines-a summary of key concepts. Pharmacy. 2016;4(4):35.
- World Health Organization. Promoting rational use of medicines: core components. Geneva: World Health Organization. 2002.
- Atif M, Sarwar MR, Azeem M, Umer D, Rauf A, Rasool A, et al. Assessment of WHO/INRUD core drug use indicators in two tertiary care hospitals of Bahawalpur, Punjab, Pakistan. Journal of pharmaceutical policy and practice. 2016;9(1):27.
- El Mahalli AA. WHO/INRUD drug prescribing indicators at primary health care centers in Eastern province, Saudi Arabia. EMHJ-Eastern Mediterranean Health Journal. 2012;18 (11):1091-1096.
- Laing RO, Hogerzeil HV, Ross-Degnan D. Ten recommendations to improve use of medicines in developing countries. Health policy and planning. 2001;16(1):13-20.
- Drug administration and control authority (DACA). Training modules on operation and management of special pharmacies, Ethiopia. 2003.
- World Health Organization. Problems of irrational drug use: Session guide. Geneva, WHO. 2010.
- Srikanth A. Assessment of Drug Related Problems and its Associated Factors among Medical Ward Patients in University of Gondar Teaching Hospital, Northwest Ethiopia: A Prospective Cross-Sectional Study. Journal of Basic and Clinical Pharmacy. 2017;8.
- Otoom SA, Sequeira RP. Health care providers' perceptions of the problems and causes of irrational use of drugs in two Middle East countries. International journal of clinical practice. 2006;60(5):565-70.
- Adibe MO, Igboeli NU, Ukwe CV. Evaluation of drug therapy problems among renal patients receiving care in some tertiary hospitals in Nigeria. Tropical Journal of Pharmaceutical Research. 2017;16(3):697-704.
- Wang H, Li N, Zhu H, Xu S, Lu H, Feng Z. Prescription pattern and its influencing factors in Chinese county hospitals: a retrospective cross-sectional study. PloS one. 2013;8(5):e63225.
- Managing Access to Medicines and Health Technologies, MDS-3. Managing for rational medicine use. Managing Science for Health. 2012.
- World Health Organization. How to investigate drug use in health facilities: selected drug use indicators. Geneva: World Health Organization. 1993.
- Food, Medicine and Healthcare Administration and Control authority of Ethiopia, National Essential Medicine List 5th Edition. Addis Ababa Ethiopia., 2014.
- Mensa M, Tadesse T, Ayele A. Assessment of Drug use Pattern by using WHO Core Drug use Indicators at Public Hospitals in Ethiopia. J Community Med Health Educ. 2017;7(559):2161-0711.
- Demeke B, Molla F, Assen A, Melkam W, Abrha S, Masresha B. Evaluation of drugs utilization pattern using WHO prescribing indicators in Ayder referral hospital, Northern Ethiopia. IJPSR. 2015;6(2):343-7.
- Berha AB, Seyoum N. Evaluation of drug prescription pattern using world health organization prescribing indicators in Tikur Anbessa specialized hospital: A Cross sectional study. Journal of Drug Delivery and Therapeutics. 201814;8(1):74-80.
- Sisay M, Abdela J, Kano Z, Araya M, Chemdi M, Fiseha A. Drug prescribing and dispensing practices in tertiary care hospital of eastern Ethiopia: evaluation with world health organization core prescribing and patient care indicators. Clinical & Experimental Pharmacology. 2017;7(03):2161-1459.
- Sisay M, Mengistu G, Molla B, Amare F, Gabriel T. Evaluation of rational drug use based on World Health Organization core drug use indicators in selected public hospitals of eastern Ethiopia: a cross sectional study. BMC health services research. 2017;17(1):161.
- Al-Azayzih A, Al-Azzam SI, Alzoubi KH, Shawaqfeh M, Masadeh MM. Evaluation of drug-prescribing patterns based on the WHO prescribing indicators at outpatient clinics of five hospitals in Jordan: a cross-sectional study. Int J Clin Pharmacol Ther. 2017;55:425-32.
- Pathak A, Gupta VK, Maurya A, Kumar A, Singh A. Assessment of drug prescribing pattern using who indicators in hospitalized patients at a tertiary care teaching hospital in rural area of India. Int J Basic Clin Pharmacol. 2016;5(3):651-5.
- Tefera K, Weldesenbet A, Tilahun K, Ayda R, Hafte K. Assessment of Medicines use in Eastern Ethiopian Hospital: A Cross Sectional Study. Int. Res. J. Microbiol. 2018;7(2): 043-061.
- Lukali V, Michelo C. Factors associated with irrational drug use at a district hospital in Zambia: patient record-based observations. Medical Journal of Zambia. 2015;42(1):25-30.
- Chandelkar UK, Rataboli PV. A study of drug prescribing pattern using WHO prescribing indicators in the state of Goa, India. Int J Basic Clin Pharmacol. 2014;3(6):1057-1061.
- World Health Organization. Promoting rational use of medicines: core components. Geneva: World Health Organization; 2002.
- Machowska A, Stålsby Lundborg C. Drivers of irrational use of antibiotics in Europe. International journal of environmental research and public health. 2019;16(1):27.
- Chandy SJ. Consequences of irrational use of antibiotics. Indian J Med Ethics. 2008;5(4):174-5.
- Understanding the Role and Use of Essential Medicines Lists. IMS Institute for Healthcare Informatics; 2015.
Citation: Kasahun GG, Demoz GT, Asayehegn AT, Gebrehiwot LG, Tesfay GM, Desta DM (2020) Evaluation of Pattern of Drug Use in Tertiary Health Care Setting in Central Tigray Using WHO Prescribing Indicators. Adv Pharmacoepidemiol Drug Saf. 9:229. doi: 10.35248/2167-1052.20.9.229
Copyright: © 2020 Kasahun GG, et al. This is an open-access article distributed under the terms of the Creative Commons Attribution License, which permits unrestricted use, distribution, and reproduction in any medium, provided the original author and source are credited.