
Indexed In
- Open J Gate
- Genamics JournalSeek
- ResearchBible
- RefSeek
- Directory of Research Journal Indexing (DRJI)
- Hamdard University
- EBSCO A-Z
- OCLC- WorldCat
- Scholarsteer
- Publons
- MIAR
- Euro Pub
- Google Scholar
Useful Links
Share This Page
Journal Flyer
Open Access Journals
- Agri and Aquaculture
- Biochemistry
- Bioinformatics & Systems Biology
- Business & Management
- Chemistry
- Clinical Sciences
- Engineering
- Food & Nutrition
- General Science
- Genetics & Molecular Biology
- Immunology & Microbiology
- Medical Sciences
- Neuroscience & Psychology
- Nursing & Health Care
- Pharmaceutical Sciences
Research Article - (2019) Volume 8, Issue 1
Effects of High and Low Glycemic Load of Different Nigerian Food Forms on Rats Brain and Heart Mitochondrial Integrity
Egwim EC* and Yakubu GReceived: 20-Jan-2019 Published: 07-Feb-2019, DOI: 10.35248/2161-1009.19.8.377
Abstract
The present study was designed to investigate the effect of glycemic load (GL) on brain and cardiac mitochondrial integrity. The effect of high glycemic load (HGL) and low glycemic load (LGL) diets on the generation of free radicals and its consequent effect on brain and cardiac mitochondrial were assessed. The effect of the reactive oxygen species (ROS) on the activities of electron transport chain (ETC) was examined. A significant decline in enzyme activities of complex I, III and IV were observed, for both brain and cardiac mitochondria ETC. Brain rotenone-sensitive complex I activities decreased by 49.20% (p>0.05) in HGL-fed rats, while antimycin-a sensitive complex III decreased by 19.80% (p>0.05). Same phenomenon was observed in potassium cyanide (KCN)-sensitive complex IV (cytochrome c oxidase), which decreased by 30.17% (p>0.05). For cardiac mitochondrial complexes, Rotenone-sensitive complex I decreased by 25.45% (p>0.05) in HGL fed group, while antimycin-a sensitive complex III activity decreased by 24.78% (p>0.05). Glycemic related changes were also observed in KCN-sensitive complex IV with a decrease of 21.18% (p>0.05). Enzyme activities in both brain and cardiac mitochondrial homogenates decrease minimally in LGL fed rats, compared with the control. Thiol group content, total protein and malondialdehyde (MDA) were found to be significantly elevated in rats fed with HGL diet. Superoxide dismutase (SOD) and catalase (CAT) enzymes activities decreased in both brain and cardiac mitochondria of rats fed with HGL diets. It can be concluded that low glycemic load diet sustains the mitochondrial integrity. Whereas, HGL diets induced oxidative stress and degenerates antioxidant enzymes activities in brain and heart mitochondria; thereby inducing loss of mitochondrial integrity.
Keywords
Carbohydrate; Antioxidants; Free radicals; Superoxide dismutase; Mitochondria
Introduction
The Glycemic Load (GL) is a relatively new way to assess the impact of carbohydrate consumption in the body system. Glycemic load takes the glycemic index (GI) into account, and gives clear picture than do GI GL alone. Glycemic Load is calculated by multiplying the GI by the number of grams of carbohydrate (CHO) in a serving of the food. GL is a measure that incorporates both the quality and quantity of dietary CHO [1]. Wylie-Rosett et al. [2] stated that GL was developed as a way of comparing the glucose-raising effect of foods with widely differing amounts of CHO's. The higher the glycemic load the greater the expected elevation in blood glucose and insulinogenic effect of the food. Long term consumption of a diet with relatively high glycemic load diet is associated with an increased risk of type 2 diabetes and coronary heart disease (CHD), increase insulin resistance and reduction of insulin sensitivity, decline concentration of high-density lipoprotein, increase the risk of metabolic syndrome and facilitates weight gain [3]. According to Wylie-Rosett et al. [2] confirmed that a low-glycemic load diet slows absorption and lessens hyperinsulinaemia, the implication of this phenomena promotes appropriate weight loss, improve cardiovascular health, and reduce diabetes. Some foods with a high glycemic index such as carrots may have a low glycemic load.
Modern life habits are characterized by low energy expenditure by daily excessive ingestion of foods rich in carbohydrates and lipids, to ensure positive energetic balance a reality. The consequence is the increase of the body mass index (BMI) and the prevalence of obesity, in developed as well as developing countries [4,5].
Eating habit characterized by the consumption of high glycemic index (HGI) and high glycemic load (HGL) diet has its dire health consequences [6]. The consumption of this type of diet is responsible for the increase of the prevalence of obesity [7-9], which might lead to the alteration of the oxidative state and inflammatory markers (monocyte-derived macrophages), besides favouring lipogenesis, hyperglycemia, hyperinsulinemia, reduction of insulin sensibility, increase insulin resistance hypertriglyceridemia and decrease the concentration of HDL-cholesterol in the blood [10].
The alteration of the oxidative state as a result of the increase in production of reactive oxygen species (ROS) and the reduction of antioxidant concentrations can be explained by the constant hyperglycemia generated by the chronic consumption of HGI and HGL diets [11]. Hyperglycemia–induced increases in glucose autoxidation, protein glycation and the subsequent oxidative degradation of glycated protein which can lead to enhanced production of reactive oxygen species (ROS) [12]. The levels of ROS are regulated by a variety of cellular defense mechanisms consisting of enzymic and non-enzymic (glutathione, α-tocopherol and other ROS scavengers) systems. High levels and/or inadequate removal of ROS may cause severe metabolic imbalance and oxidative damage to biological macromolecules [13]. Furthermore, the hyperinsulinemia associated to insulin resistance can increase the production and release of powerful endothelial vasoconstrictor called endothelin-1, leading to endothelial cellular injury [14].
Most reactive oxygen species (ROS) are generated as by-products during mitochondrial electron transport. In addition, ROS are formed as necessary intermediates of metal catalyzed oxidation reactions. Free radicals are atomic oxygen which possesses two unpaired electrons (free radicals) in separate orbits in its outer electron shell. This electron structure makes oxygen susceptible to radical formation. The sequential reduction of oxygen through the addition of electrons leads to the formation of a number of ROS including: superoxide; hydrogen peroxide; hypobromous acid, peroxynitrite, hydroxyl radical; hydroxyl ion; and nitric oxide [15].
Materials and Methods
Experimental animals
Eighteen (18) Albino rats, nine male and nine females bought at IBB University Lapai, Biochemistry Department and were divided into three groups of 6 rats each. The animals were maintained as described by Kaplan et al. [16]. All experiments were performed in accordance with the “Guideline for the Care and Use of laboratory Animals” published by The US National Institute of Health (NIH publication NO 85-23, revised 1996).
Test foods were classified into high and low glycemic load. The first two groups were fed with HGL and LGL diet as normally prepared for human consumption. Boiled yam classified as high glycemic load food, was prepared by peeling yam, sliced and 40 g of the slide yam was boiled with 250 ml until softened 5 g of table salt and 20 ml of red oil (palm oil) was added to give taste, and served to group-1 with 30 ml stew well stirred. Tuwon acha a low glycemic load food was prepared by mixing 35 g of Acha grain (Digiteria exilis) in 250 ml boiling water turned until paste is formed. It was served to group-2 with 30 ml stew to the various respective groups. The control group-3 were fed with commercial feeds (i.e. grower feeds). The commercially formulated feeds contain 15% crude protein, 7% fat, 10% crude fiber, 1.0% calcium 0.35% of available phosphorous and 2550 Kcal/Kg of metabolizable energy. The animals were fed with the classified diet for 2 months, after which the animals were sacrificed the brain and heart were removed for further analysis.
Isolation of brain and heart mitochondria
The animals were sacrificed by decapitation after anesthetization. After removal of the cranium by incision, the Brain and heart were immediately removed and washed with physiological solution and stored at –80°C for further analysis. Frozen powdered tissue of the whole brain and heart (about 1 g each) was thawed in 10 volumes of ice-cold homogenization buffer (30 mM KH2PO4, 5 mM EDTA, 0.3 M sucrose, adjusted to pH 7.0) with 0.3 mM phenylmethylsulfonyl fluoride (PMSF) and homogenized in Potter- Elvehjemhomogenizer. Brain and heart mitochondrial fraction were isolated from individual tissue homogenates by differential centrifugation as previously described by Babusikova et al. [17]. The supernatant from homogenate centrifugation (1000×g for 10 mins) was further centrifuge at 18,000×g for 35 mins; the supernatant was decanted. Pellet was used (as it contained the mitochondria). The determination of enzyme activities was carried out based on Babusikova, et al. [17], Nulton-Persson and Szweda [18], Powell and Jackson [19] and Racay, et al. [20] protocols that arrived at various protein concentrations (in complex I, II, III and IV).
Determination of enzyme activities from brain and cardiac mitochondria
Complex I (NADH-ubiquinone oxidoreductase): The oxidation of NADH by complex I was recorded using the ubiquinone analogue decylubiquinone as electron acceptor [18]. The basic assay medium (35 mM KH2PO4, 5 mM MgCl2 and 2 mM KCN, pH 7.2) was supplemented with 5 μM antimycin A, 60 μM decylubiquinone and 0.1 mM NADH in final volume of 1 ml. The enzyme activity was measured by starting the reaction with 50 μg of mitochondrial protein at 30°C. The decrease in absorption due to NADH oxidation was measured at 340 nm using molar absorption coefficient ε=6.2 mM-1cm-1.
Complex II (succinate-ubiquinone oxidoreductase or succinate dehydrogenase, SDH): Succinate dehydrogenase activity was measured according to Powell and Jackson [19], as the rate of 2, 6-dichlorophenolindophenol (DCIP) reduction at 600 nm (ε=21 mM-1cm-1) upon addition of 0.2 M KH2PO4 (pH 7.6), 0.1 M NaCN, 0.02 M phenazine methosulfate, 0.5 M succinate and 1 mM DCIP to mitochondria (0.15 mg protein per ml) and incubated at 30°C for 5 minutes before taking the absorbance.
Complex III (ubiquinol- cytochrome c reductase): Activity of cytochrome c reductase was determined as the rate of antimycin A-dependent reduction of cytochrome c at 550 nm (ε=18.5 mM- 1cm-1) [18]. Mitochondria (0.05 mg protein per ml) were incubated at 30°C in medium containing 35 mM KH2PO4, 5 mM MgCl2, 2 mM KCN and 0.05% Triton X-100, pH 7.2 and reaction was started with 60 μM reduced decylubiquinone and 50 μM of cytochrome c.
Complex IV (cytochrome c oxidase): Activity of cytochrome c oxidase was determined spectrophotometrically by monitoring the rate of cytochrome c oxidation at 550 nm (ε=19.6 mM-1cm-1) as described by Racay et al. [20]. Mitochondria (0.05 mg protein per ml) were incubated at 30°C in medium containing 50 mM Tris- HCl (pH 8.0), 0.01% (w/v) n-dodecyl β-D-maltoside and reaction started with 5 μM of reduced cytochrome c.
Citrate synthase: Citrate synthase activity was measured spectrophotometrically by monitoring the formation of CoASH with 2, 2-dithiobisnitrobenzoic acid (DTNB). Mitochondria (0.04 mg protein per ml) were incubated at 25°C in assay buffer containing 0.3 mM acetyl CoA and 0.1 mM 2, 2-dithiobisnitrobenzoic acid (DTNB). The reaction was started by the addition of 0.5 mM oxaloacetate and reduction of DTNB was followed at 412 nm (ε=13.6 mM-1cm-1) described in Tatarkova et al. [21].
Total protein test
Calorimetric determination of total protein (with the use of protein kit) is based on the principle of the biuret reaction (copper salt in an alkaline medium). Protein in plasma or serum forms a blue coloured complex when treated with cupric ions in alkaline solution. The intensity of the blue colour is proportional to the protein concentration. Procedure is shown in Table 1 below. The samples were mixed and incubate for 10 minutes at 37°C, and the absorbance of standard and sample were read against reagent blank at 546 nm.
Calculations: 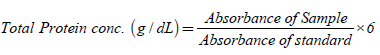
Table 1: Total protein test.
| Blank | Standard | Sample | |
|---|---|---|---|
| Reagent | 1000 µL | 1000 µL | 1000 µL |
| Standard | 20 µL | ||
| Sample | 20 µL |
Where: sample absorbance=the absorbance value for the sample, standard sample=the absorbance value for standard.
Lipid peroxidation
The supernant of 1 ml was added to 2 ml (1:1:1 ratio) Trichloro Acetic acid-Thiobarbeturic acid-Hydrochloric acid (TCA-TBA-HCl) reagent. (TBA-0.37%), 0.24 N HCl, 15% TCA. the mixture was boiled at 100°C for 15 mins and allowed to cool. It was Centrifuge at 3000 rpm for 10 mins. The supernatant was removed and the absorbance read at 532 nm against a blank. (Malondialdehyde) MDA was calculated using the molar extinction coefficient for MDA TBA- complex of 1.56× 10⁵ Mc-1 M-1.
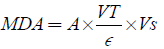
Where A=absorbance, VT=Total volume, Vs=sample Volume, ∈ =molar extinction. 0.185 g of TBA in 50 ml, 7.5 g or 7.5 ml of TCA in 50 ml, 1 ml of Conc. HCl in 49 ml H2O.
Determination of superoxide dismutase activity (sod)
Superoxide dismutase activity was determined by the method of Misra and Fridovich [22]. Where 1 ml of sample was diluted in 9 ml distilled water to make 1 in 10 dilutions. An aliquot of the diluted sample was added to 2.5 ml of 0.05 M Carbonate buffer, pH 10.2 to equilibrate in the spectrophotometer and the reaction started by addition of 0.3 ml of freshly prepared 0.3 mM adrenaline to the mixture, which was quickly mixed by inversion. The reference cuvette contained 2.5 ml buffer, 0.3 ml of substrate (adrenaline) and 0.2 ml distilled water.
Calculations: 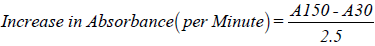
Where A30=Absorbance after 30 seconds,
A150=Absorbance after 150 seconds,
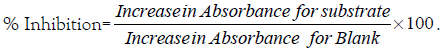
One unit of SOD activity was given as the amount necessary to cause 50% inhibition of the oxidation of adrenaline to adenochrome during 1 minute.
Determination of catalase activity
Catalase activity was determined according to sinha [23]. It was assayed calorimetrically at 620 nm and expressed as μmoles of H2O2 consumed/min/mg portion at 25°C. The reaction mixture (1.5 ml) contained 1.0 ml of 0.01 M phosphate buffer (pH 7.0), 0.1 ml of tissue homogenate and 0.4 ml of 2 M H2O2. The reaction mixture was stopped by the addition of 2.0 ml of dichromate and glacial reagent (5% potassium dichromate- acetic acid were mixed in 1:3). ∈=40 M-1 cm-1
Calculations: 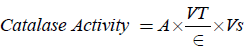
Where A=change in absorbance,
VT=Total Volume, Vs=Sample Volume, ∈=molar extinction.
Total thiol group content
Total thiol group content in brain and cardiac mitochondria (aliquots of 0.15 mg proteins) was determined spectrophotometrically as described by Sivonová et al. [24]. Samples were incubated in medium containing 30 mM imidazole (pH 7.4), 5 mM EDTA, and 0.4 mM 2, 2-dithiobisnitrobenzoic acid (DTNB). After 10 min incubation at room temperature the sample absorbance was measured at 412 nm together with the absorbance of reagent blank. The thiol group content was calculated using molar absorption coefficient ε=13,600 M1cm-1.
Statistical analysis
Data are expressed as means ± S.E.M. of 6 replicates. One-way analysis of variance with post-hoc comparisons by Student-Neuman- Keuls test was carried out to test for differences among groups. A value of p<0.05 was considered to be statistically significant.
Results
Glycemic load-related changes in activities of electron transport chain complexes in brain and cardiac mitochondria
The evaluation of the effect of glycemic load on mitochondrial function and enzyme activities were measured for complexes I-IV of brain and cardiac mitochondria isolated from 5-months old albino rats fed with normal, high and low glycemic load diets. The brain mitochondria of the animals fed with the three categories of food shown in Figure 1. The rotenone-sensitive complex I activity decreased by 49.26% (p>0.05) in HGL-diet fed rats and 12.58% (p>0.05) in LGL-diet group compared to the control groups. Complex II activities decreased by 18.34% (p>0.05) in rats fed with high glycemic load diet, compared rats fed low glycemic load diets decreased by 11.49% (p>0.05) which was also significantly lower than that of the control. Antimycin a sensitive complex III decreased by 19.80% (p>0.05) in rats fed high glycemic load diets, compared to the group fed low glycemic load diets less in enzyme activity by 6.85% at p>0.05. KCN-sensitive complex IV activity decreased by 30.17% (p>0.05) for high glycemic load diet fed groups and 13.55% (p>0.05) for low glycemic load fed groups.

Figure 1: Effect of Glycemic load on Brian mitochondrial enzyme activities of the electron transport complexes. Values are given as mean ± S.E.M. of 6 replicates. Values with different letters are significant different at p<0.05.
Cardiac mitochondria complex I-IV enzyme activities were significantly higher in rats fed high glycemic load die complex I,III and IV, than groups of rats fed low glycemic load diets compared to the control fed diet group. Rotenone-sensitive complex I activities shown in Figure 2 decreased by 25.45% (p>0.05) in HGL-diet group, whereas LGL-diet fed rats decreased by 1.43% (p>0.05) compared to the control group. For complex II there was no significant difference compared to the fed control group. HGL-diet fed rats enzyme activities decrease by 12.64% (p<0.05), whereas LGL-diet fed group decreased by (5.28% p<0.05). In the case of antimycin a-sensitive complex III, enzyme activity decreased significantly in both HGL and LGL-diet fed rats by 24.78% (p>0.05) and 12.46% (p>0.05) respectively as compared to control group. Glycemic load-related changes were also observed in KCN-sensitive complex IV enzyme activity, HGL-diet fed group decreased by 21.18% (p>0.05) while LGL-diet fed group decreased by 10.65% (p<0.05) compared to the control group.

Figure 2: Effect of Glycemic load on cardiac mitochondrial enzyme activities of the electron transport complexes. Values are given as mean ± S.E.M. of 6 replicates. Values with different letters are significant different at p<0.05.
The result of glycemic load in relation to citrate synthase activity shown in Figure 3. The result showed citrate synthase activity decreased in brain mitochondria of rats fed HGL diets by 21.46% (p>0.05) compared to control while those fed LGL diets decreased by 14.22% (p>0.05) after 8-weeks of treatment. Citrate synthase enzyme activity decreased in cardiac mitochondria by 60.36% (P>0.05) in rats fed HGL-diets, and 51.35 % (p<0.05) in LGL-diets group compared to fed control group. Citrate synthase activities in brain and heart mitochondria of rats fed LGL diets tended towards the control groups.

Figure 3: Effect of Glycemic load on brain and cardiac mitochondrial citrate synthase activity. Values are given as mean ± S.E.M. of 6 replicates. Values with different letters are significant different at p<0.05.
Effect of glycemic load on brain and cardiac mitochondria oxidative damage
The results for brain total thiol group content increased by 18.56% (p>0.05) in rats fed high glycemic load diets and by 13.28% (p>0.05) in rats fed low glycemic load diet. In cardiac mitochondria, the thiol group content increased by 29.88% (p>0.05) in rats fed high glycemic load diet, twice higher than that of brain mitochondria, whereas rats fed low glycemic load diet decreased by 26.03% (p>0.05) as shown in Figure 4.

Figure 4: Effect of glycemic load on thiol group content in brain and cardiac mitochondria. Values are given as means ± S.E.M of 6 replicates. Values with different letters are significant different at p<0.05.
Total protein in high glycemic load diets fed group increased by 2.42% (p>0.05) while that of low glycemic load fed rats increased by 0.4% (p<0.05) compared the control. The cardiac total protein content showed rats fed high glycemic load diet increased by 3.74% (p>0.05) which was significantly higher than those fed low glycemic load diet 0.23% (p<0.05) as well as those of the control group (Figure 5).

Figure 5: Effect of glycemic load on total protein content in brain and Cardiac mitochondria. Values are given as means ± S.E.M of 6 replicates. Values with different letters are significant different at p<0.05.
Effect of glycemic load on lipid peroxidation was assessed by the measurements of peroxide end-products. Lipid peroxidation in both brain and heart mitochondria in rats fed glycemic load diets are shown in Figure 6. The malondialdehyde (MDA) level in brain mitochondria increased by 6.85% (p>0.05) in rats fed HGL diets. The rats fed LGL diets increased by 1.81% compared to the control group. Lipid peroxidation in cardiac mitochondria of rats fed HGL-diets increased by 12.72% (p>0.05) while LGL-diets fed rats decreased by 1.39% (p>0.05) compared to the control.

Figure 6: Glycemic load associated changes in MDA contents in Brain and Cardiac mitochondria homogenates. Values are given as means ± S.E.M. of 6 replicates. Values with different letters are significant different at p<0.05.
Changes in antioxidant enzymes in brain and cardiac mitochondrial rats fed different glycemic load diets
Effects of free radicals on the activities of antioxidants were assessed in both brain and heart mitochondria in rats fed glycemic load diets shown in Figure 7. The level of superoxide dismutase activity in brain mitochondria decreased by 56.37% (p>0.05) in rats fed HGL diets and 16.57% (p>0.05) in rat fed LGL-diets as compared to control. The activity of superoxide dismutase in cardiac mitochondria decreased by 78.12% (p>0.05) approximately twice in rats fed LGL-diets which decreased by 34.73% (p>0.05) compared to the control. In both brain and cardiac mitochondria of rats fed low glycemic load diets, superoxide dismutase activities tended towards the control.

Figure 7: Effect of glycemic load on brain and cardiac mitochondrial superoxide dismutase inhibition activity. Values are given as means ± S.E.M of 6 replicates. Values with different letters are significant different at <0.05.
Catalase enzyme on the other hand in brain mitochondria decreased in activity by 26.35% (p<0.05) in HGL-diet fed rats, whereas in LGL-diet fed rats decreased in activity by 11.67% (p<0.05). Same phenomenon was observed in cardiac mitochondria antioxidant activities which decreased by 27.18% (p<0.05) (Figure 8) in HGLdiet fed rats as compared to LGL-diet fed rats which decreased by 11.57% (p<0.05) in activity.

Figure 8: Effect of glycemic load on brain and cardiac mitochondrial catalase activity. Values are given as means ± S.E.M of 6 replicates. Values with different letters are significant different at p<0.05.
Discussion
Glycemic load-related changes in activities of electron transport chain complexes in brain and cardiac mitochondria
The study of mitochondrial integrity demonstrates that high glycemic load diet is associated with accumulation of lipids and proteins oxidative damage with progressive decline in activities of mitochondrial enzymes. The enzyme activities of mitochondrial electron transport complex I-IV in brain mitochondrial significantly reduced by 49.26% in complex I Figure 1, this is an indication of production of higher reactive oxygen reactive species at the first step of electron transport chain. This was in conformity to the findings of Brownlee [25] who shown that complex I the site for generation of free radicals, by implication the higher the glucose concentration the greater the ROS production. This suggests that free radicals are produced without concomitant antioxidant enzyme activities to neutralize the free radicals that reduced the activity of NADH-unbiquinone oxidoreductase. The final step that accept electron before ATP molecule is produce, complex IV enzyme reduced in activity by 30%. Production of energy will be depleted due to a declined complex enzyme activity.
High glycemic load food caused more oxidative stress on brain mitochondria in complex I, III and IV than cardiac mitochondria compared to control. There was no uniformity in electron transport; therefore, the consequence of this phenomenon leads to more production of free radicals and its eventual leakage at complex I, III and IV. The instability of mitochondria and the complex activity was as a result of ROS generation and oxidative damage caused by consumption of high glycemic load diet.
Effects of high glycemic load on cardiac mitochondrial enzymes were examined in a number of studies, with close correlation of findings. For instance, 42-46% reduction in complex I activity was demonstrated in hearts of 96-weeks-old rats [26], compared to the outcome of the present research for 20 weeks-old rat that were fed with high glycemic load diet recorded 25% reduction in complex I, 24% declined in enzyme activity for complex III and 21% reduction in complex IV, this indicates that oxidative damage increases as the rats continued to consume the high glycemic load foods shown in Figure 2. Other studies have reported no high glycemic loadrelated decrease in activity [27,28]. The decrease in enzyme activity in brain and cardiac mitochondrial complex I-IV, are in agreement with other study, which showed small but significant ~9% decrease in activity by 12-14% and ~13% decrease in 20-22-month old mouse heart mitochondria [29]. Activities of complexes III and IV declines due to ROS activities [26,30], remain unchanged or increased [28-30] as the animals consume high glycemic load diets. From the evaluation of electron transport chain enzyme activities of brain and heart mitochondrial of the rats fed, reactive oxygen species inhibits cytochrome c oxidase activity [31]. In line with this finding, we observed a reduction in the activities of complex III (cytochrome c reductase) and IV (cytochrome c oxidase) of the respiratory chain, leading to the impairment of the cell energy state, this have profound physiologic consequence which my lead to apoptosis and ageing, ROS may also contribute to cell damage in diabetes, modulating glucose entry into the cells [32].
Complex II in both brain and cardiac mitochondria showed no significant difference for HGL and LGL fed rats compared to the controlled group. Other researchers have reported that complex II show declined in activity [26,28] unchanged in the case of Preston et al. [33].
Free radicals oxidize protein and lipid molecules thus leading to oxidative stress in mitochondrial organelle. This cause irreversible change to the structural function of protein (e.g. carbonyl and 4-hydroxynonena (HNE)) of the body system will degenerates due to oxidative damage on the protein. Increase activities of free radicals in cell mitochondria results to redox stress, these cause regulatory changes e.g. biological signals and irreversible changes depending on degree of oxidative damage on the cells. Inhibition and oxidative damage results to cell dysfunction, these explain the mechanism of healthy cells becoming pathological, as oxidative stress persists. Homeostasis and redox signaling lost control as a result of oxidative damage. Persistence of redox stress facilitates aging activities, complications of diabetes mellitus, as well other degenerative diseases such like Alzheimer’s and Parkinson diseases [34].
Citrate synthase is a pace-maker enzyme in the Krebs cycle (citric acid cycle or tricarboxylic acid cycle, TCA) [35]. Citrate synthase (CS) is commonly used as a quantitative marker enzyme for the content of intact mitochondria [35-37]. Proliferation of mitochondria in pathological states is sometimes associated with an increase in CS activity per cell or decrease in activity due to oxidative damage exerted on the enzyme [38]. In the present study citrate synthase activity was reduced by 21% in brain mitochondria and 51% reduction in cardiac mitochondrial (Figure 3). This evidently showed that oxidative damage occurred on protein molecule of the mitochondrial. The impact of the oxidative damage was more on the heart due to high production of free radicals than the brain mitochondria. The present finding implies that the condensation reaction of acetyl-coA and oxaloacetate to form citrate cannot be formed effectively, as a result of enzyme citrate synthase reduction in activity because of oxidative damage or stress. These have a direct consequence on the kreb cycle and the generation of NADH for the production of ATP molecule in ETC. Reduction in ATP decreases the efficiency of cell metabolic process leading to accelerates cell ageing and pathological cases [39,40].
Effects of glycemic load on brain and cardiac mitochondria oxidative damage
Thiol group content from brain mitochondria for animals fed with high glycemic load increased by 18.56%, whereas cardiac thiol increased by 29.88% indicating that oxidation of thiol protein molecule was more pronounced on heart mitochondria (Figure 4). Thiol group is a measure of oxidative stress that indicates oxidative damage to protein molecules It stands as a marker of protein molecule glycosylation initiated by which this process of glycosylation impairs the functioning of biomolecules like DNA, RNA and other specialized functional protein molecules to produce advanced glycated end products (AGEs) which are potential carcinogens [41]. AGEs at activation, may appear negligible and in disease cases, but at advanced state and accumulated, may cause cell death [42].
The total protein from the cardiac mitochondrial of animals fed high glycemic load increased by 3.37% while that from the brain increased by 2.42% compared to control (Figure 5). This means that postprandial hyperglycemia may affect the levels of protein molecule in the mitochondria.
Feeding animals with HGL-diet food, results in the increased production of free radicals and oxidative damage to the membrane lipid layer, this was evident in high level of malodialdehyde (MDA) adjunct byproducts. Brain mitochondrial malondialdehyde increased by 6.85% compared to control. Cardiac mitochondria MDA formed increased by 12.72%, about two times that of the brain (Figure 6). These means the rate of lipid peroxidation increases when animals were continuously fed with high glycemic load diet. The outcome of the research demonstrates that consumption of high glycemic load food is associated with accumulation of oxidative damage to lipids, proteins and a progressive decline in activities of mitochondrial enzymes. High glycemic load diet increases lactate accumulation, delays the recovery of energy metabolism, and enhances the lipid peroxidation in the transient ischemia of rat brain, these findings may explain the harmfulness of hyperglycemia (due to high glycemic load food) in clinical cerebral ischemia [43].
Differences in the parameter or variables used in this research compared to other related work done on mitochondrial is in the age of the animals used, where high glycemic load food increased free radical generation. In some related studies [27,28] the aged groups (24-28 months) fed with HGL diet compared to rats aged 3-5 months used in the research stands to have different results. This may lead to underestimation of declined enzyme activities of electron transport chain (ETC) complexes in heart for animals fed with HGL-diet. It could be inferred that, the young animals used in this research work as they continue to feed on HGL diets when they are advanced age ETC enzymes decline in activities due to oxidative stress.
Total protein and thiol group content are consistent with previously reported data of hyperglycemic-related changes reported by Babusikova et al., Cocco et al., Choksi and Papaconstantinou, Leeuwenburgh et al. [17,28,29,44] other researchers have reported that there is no protein oxidative damage in heart mitochondria [27]. Function of ETC complexes depends also on structural integrity of membrane lipid bilayer. Increase in the biomarkers of lipid peroxidation, for brain and cardiac mitochondria as observed in the present work indicated that high glycemic load diet is associated with significant lipid damage. Although elevated lipid peroxidation in myocardial age-related case has been demonstrated in several studies [17,28,29,44,45]. This suggests that continuous consumption of high glycemic load foods may pose mitochondria myocardial infacta. The malondialdehyde levels elevated in HGLdiet fed animals observed in the study showed values 0.64 nmol/ mg protein and 0.58 nmol/mg protein in brain and cardiac mitochondria respectively. These values showed correlation to the work of Cocco et al. [28] of age-related value of (~0.6-0.8 nmol/mg protein) were lower than those observed animals up to weeks and above ~1.2-3.6 nmol/mg protein.
Electron transport chain complexes and oxidative stress outcome from this research and other major studies, demonstrates that high glycemic load diets may impair the ETC. The decrease activity or inhibition of ETC enzymes can result in altered electron flow through the chain, that can impair ATP production, as observed in the non-uniform inhibition of the ETC of brain and heart mitochondrial electron of HGL diet fed rats.
Changes in antioxidant enzymes in brain and cardiac mitochondrial rats fed different glycemic load diets
The brain and cardiac mitochondria of HGL fed rats show increased ROS levels which is associated with reduced antioxidant barriers, in terms of superoxide dismutase (SOD) and catalase (CAT) content. The relative percentage change in SOD and CAT enzyme degenerates in activity is shown in Figures 7 and 8. The result showed that both SOD and CAT decline in activity by 56.37% and 26.35% (p>0.05) respectively for brain mitochondria fed with high glycemic load food. Cardiac mitochondria of high glycemic load diet fed rats, the antioxidant enzymes decrease significantly in their activity by 78.12% for SOD and 27.18% for CAT respectively, suggesting a significant oxidative stress. These enzymes are known indigenous free radicals’ scavengers. Catalase known as the second line scavenger of free radicals involved in the breaking of 2H2O2 byproduct of SOD to harmless form (i.e. 2H2O and O2). Result in Figure 4 showed that the rate at which free radical was produced surpassed the capacity the antioxidants can act on. The oxidative stress exerted on protein molecule eventually overwhelms its biological functions.
In most diseases characterized by tissue damage, oxidative stress may either be a cause or a consequence of this damage [46]. Cumulative or steady-state oxidative damage may increase in diabetism in response to an increase in oxidizable substrate (carbohydrate or lipid), an increase in the rate of autoxidation of substrate, declines the antioxidant defense or a combination of all these processes could have occurred. The ROS generated by the autoxidation of carbohydrates and lipids may further auto-catalytically enhance the rate of autoxidation and facilitates oxidative damage as observed in the work of Baynes and Thorpe [47].
Altered ROS expression and activity increase free radical production, which overwhelms the detoxifying reactions so that the effects mediated by reactive oxygen species prevail. Such like peroxynitrite, a harmful oxidant formed by reaction between superoxide and NO, reacts with a variety of molecules, including protein and non-protein-thiols, unsaturated fatty acids and DNA [48].
Oxidative stress can occur as a result of increased ROS generation and/or depressed antioxidant system. This was observed in high percent of 56.37% and 73.12% antioxidant depression of superoxide dismutase and catalase enzyme activity respectively. The natural antioxidant system consists of numerous antioxidant compounds and several antioxidant enzymes such as SOD, CAT and glutathione (GPX). Superoxide dismutase reduces lipid peroxides and plays a role in cellular defense against ROS. Primary ROS produced in the aerobic organisms is superoxide radical that is highly reactive cytotoxic agent. Superoxide radical is converted to H2O2 by SOD. Hydrogen peroxide ion (H2O2) in turn, is converted to molecular oxygen and H2O by either CAT or GPX. Glutathione can reduce lipid peroxides and other organic hydroperoxides that are highly cytotoxic products, thus SOD, CAT and GPX constitute the principal components of the antioxidant system.
Brain mitochondria of rats fed HGL showed a consistent reduction of ATP levels, as a result of the prominent changes in activity of the mitochondrial respiratory chain enzymes. ATP molecule is involved in the maintenance of membrane potential therefore; a reduction in ATP would produce an irreversible drop in membrane potential opening the permeability transition pore and triggering mechanisms of cell death [49,50]. Decrease in CAT activity as a result of prolong exposure to blood hyperglycemia caused the inability of the natural response of the cell to cope with oxidative stress, and is inhibited by glycation.
ROS was found to be elevated in both brain and heart mitochondria as reflected in the decline activities of superoxide dismutase and catalase enzymes due to the imbalance in ETC. the consequence of this findings was that the free radicals can attack molecules near the sites of their generation, thus strengthening ETC dysfunction. Accumulation of oxidative damage as a result of continual consumption of high glycemic load food caused oxidative stress which interferes with mitochondria integrity [51].
Conclusion
It can be concluded that HGL diets induced oxidative stress and degenerate antioxidant enzymes activities in brain and heart mitochondria, thereby inducing loss of mitochondrial integrity.
Acknowledgement
We wish to thank the Centre for Genetic Engineering and Biotechnology, Federal University of Technology Minna, Niger state Nigeria, for the permission to carry out the laboratory work.
REFERENCES
- Barclay AW, Brand-Miller JC, Wolever TM. Glycemic index, Glycemic load and Glycemic response are not the same. Diabetes Care. 2005;28:1839-1840.
- Wylie-Rosett J, Segal-Isaacson CJ, Segal-Isaacson A. Carbohydrates and Increases in Obesity: Does the Type of Carbohydrate Make A Difference? Obes Res. 2004;12:124S-129S.
- Tardif JC, Grégoire J, Bourassa MG. Antioxidants and restenosis-Human studies. Antioxidants and Cardiovascular Disease. 2000;233:175-191.
- Barreto SM, Pinheiro ARDO, Sichieri R, Monteiro CA, Filho MB. Analysis of the Global Strategy for Food, Physical Activity and Health, of the World Health Organization. Epidemiol Health Serv. 2005;14:41-68.
- Blair SN, Church TS. The fitness, obesity, and health equation: is physical activity the common denominator? JAMA. 2004;292:1232-1234.
- Hu FB, Stampfer MJ, Manson JE, Grodstein F, Colditz GA, Speizer FE, et al. Trends in the Incidence of Coronary Heart Disease and Changes in Diet and Lifestyle in Women. N Engl J Med. 2000;343:530-537.
- Ebbeling CB, Leidig MM, Sinclair KB, Hangen JP, Ludwig DS. A Reduced-Glycemic Load Diet in the Treatment of Adolescent Obesity. Arch Pediatr Adolesc Med. 2003;157:773-779.
- Ludwig DS. The glycaemic index. Physiological mechanisms relating to obesity, diabetes and cardiovascular disease. JAMA. 2002;287:2414-2423.
- Silva MVL, Alfenas RCG. Effect of the glycemic index on lipid oxidation and body composition. Nutr Hosp. 2011;26:48-55.
- Frost G, Leeds AA, Dore CJ, Madeiros S, Branding S, Dornhorst A. Glycaemic Index as Determinant of Serum HDL-Cholesterol Concentration. Lancet. 1999;353:1045-1048.
- Brown AA, Hu FB. Dietary modulation of endothelial function: implications for cardiovascular disease. Am J Clin Nutr. 2001;73:673-686.
- Kakkar R, Mantha SV, Radhi J, Prasad K, Kalra J. Antioxidant defense system in diabetic kidney: A time course study. Life Sci. 1997;60:667-679.
- Mates JM, Perez-Gomez C, Nunez DeCastro I. Antioxidant enzymes and human diseases. Clin Biochem. 1999;32:595-603.
- Mather K, Anderson TJ, Verma S. Insulin action in the vasculature: physiology and pathophysiology. J Vasc Res. 2001;38:415-422.
- Halliwell B, Whiteman M. Measuring reactive species and oxidative damage in vivo and in cell culture: how should you do it and what do the results mean? Br J Pharmacol. 2004;142:231-255.
- Kaplan P, Tatarkova Z, Racay P, Lehotsky J, Pavlikova M, Dobrota D. Oxidative modifications of cardiac mitochondria and inhibition of cytochrome c oxidase activity by 4-hydroxynonenal. Redox Rep. 2007;12:211-218.
- Babusikova E, Kaplan P, Lehotsky J, Jesenak M, Dobrota D. Oxidative modification of rat cardiac mitochondrial membranes and myofibrils by hydroxyl radicals. Gen Physiol Biophys. 2004;23:327-335.
- Nulton-Persson AC, Szweda LI. Modulation of mitochondrial function by hydrogen peroxide. J Biol Chem. 2001;276:23357-23361.
- Powell CS, Jackson RM. Mitochondrial complex I, aconitase, and succinate dehydrogenase during hypoxia re-oxygenation: Modulation of enzyme activities by MnSOD. Am J Physiol Lung Cell Mol Physiol. 2003;285:L189-L198.
- Racay P, Tatarková Z, Drgová A, Kaplan P, Dobrota D. Ischemia-reperfusion induces inhibition of mitochondrial protein synthesis and cytochrome c oxidase activity in rat hippocampus. Physiol Res. 2009;58:127-138.
- Tatarková Z, Kuka S, Račay P, Lehotský J, Dobrota D, Mištuna D, et al. Effects of Aging on Activities of Mitochondrial Electron Transport Chain Complexes and Oxidative Damage in Rat Heart. Physiol Res. 2011;60:281-289.
- Misra HP, Fridovich I. The role of superoxide anion in the autoxidation of epinephrine and a simple assay for superoxide dismutase. J Biol Chem. 1972;247:3170-3175.
- Sinha AK. Calorimetric assay of Catalase. Anal Biochem. 1972;47:389-394.
- Sivoňová M, Tatarkovám Z, Ďuračková Z, Dobrota D, Lehotský J, Matáková T, et al. Relationship between Antioxidant Potential and Oxidative Damage to Lipids, Proteins and DNA Inaged Rats. Physiol Res. 2007;56:757-764.
- Brownlee M. The pathobiology of diabetic complications: a unifying mechanism. Diabetes. 2005;54:1615-1625.
- Kumaran S, Subathra M, Balu M, Panneerselvam C. Age-associated decreased activities of mitochondrial electron transport chain complexes in heart and skeletal muscle: role of L-carnitine. Chem Biol Interact. 2004;148:11-18.
- Davies SM, Poljak A, Duncan MW, Smythe GA, Murphy MP. Measurements of protein carbonyls, ortho and meta-tyrosine and oxidative phosphorylation complex activity in mitochondria from young and old rats. Free Radic Biol Med. 2001;31:181-190.
- Cocco T, Sgobbo P, Clemente M, Lopriore B, Grattagliano I, Di Paola M, et al. Tissue-specific changes of mitochondrial functions in aged rats: effect of a long-term dietary treatment with N-acetylcysteine. Free Radic Biol Med. 2005;38:796-805.
- Choksi KB, Papaconstantinou J. Age-related alterations in oxidatively damaged proteins of mouse heart mitochondrial electron transport chain complexes. Free Radic Biol Med. 2008;44:1795-1805.
- Kwong LK, Sohal RS. Age-related changes in activities of mitochondrial electron transport complexes in various tissues of the mouse. Arch Biochem Biophys. 2000;373:16-22.
- Clancy RM, Levartosky D, Leszczynska-Piziak J, Yegudin J, Abramson S. Nitric oxide reacts with intracellular glutathione and activates the hexose monophosphate shunt in human neutrophils: evidence for S-nitrosoglutathione as a bioactive intermediary. PNAS. 1994;91:3680-3684.
- Behall KM, Hallfrisch J. Plasma glucose and insulin reduction after consumption of breads varying in amylose content. Eur J Clin Nutr. 2002;56:913-920.
- Preston CC, Oberlin AS, Holmuhamedov EL, Gupta A, Sagar S, Syed RH, et al. Aging-induced alterations in gene transcripts and functional activity of mitochondrial oxidative phosphorylation complexes in the heart. Mech Ageing Dev. 2008;129:304-312.
- Marcinek DJ, Siegel MP. Targeting redox biology to reverse mitochondrial dysfunction. Aging (Albany NY). 2013;5:588-589.
- Hood D, Zak R, Pette D. Chronic stimulation of rat skeletal muscle induces coordinate increases in mitochondrial and nuclear mRNAs of cytochrome-c-oxidase subunits. Eur J Biochem. 1989;179:275-280.
- Holloszy J, Oscai LB, Don IJ, Mole PA. Mitochondrial citric acid cycle and related enzymes: Adaptive response to exercise. Biochem Biophys Res Commun. 1970;40:1368-1373.
- Williams RS, Salmons S, Newsholme E, Kaufman RE, Mellor J. Regulation of nuclear and mitochondrial gene expression by contractile activity in skeletal muscle. J Biol Chem. 1986;261:376-380.
- Renner K, Amberger A, Konwalinka G, Kofler R, Gnaiger E. Changes of mitochondrial respiration, mitochondrial content and cell size after induction of apoptosis in leukemia cells. Biochem Biophys Acta. 2003;1642:115-123.
- Chernyak BV, Dukhovich VF, Khodjaev E. Regulation of ATP hydrolysis in hepatoma 22a mitochondria. Arch Biochem Biophys. 1991;286:604-609.
- Ristow M, Pfister MF, Yee AJ, Schubert M, Michael L, Zhang CY, et al. Frataxin activates mitochondrial energy conversion and oxidative phosphorylation. Proc Natl Acad Sci USA. 2000;97:12239-12243.
- Macip S, Igarashi M, Fang L, Chen A, Pan ZQ, Lee SW, et al. Inhibition of p21-mediated ROS accumulation can rescue p21-induced senescence. EMBO J. 2002;21:2180-2188.
- Stadman ER. Importance of individuality in oxidative stress and aging. Free Radic Biol Med 2002;33: 597-604.
- Roh JK, Hong SB, Yoon BW, Kim MS, Myung H The effect of hyperglycemia on lipid peroxidation in the Global Cerebral ischemia of the Rat. J Korean Med Sci. 1992;7:40-46.
- Leeuwenburgh C, Wagner P, Holloszy JO, Sohal RS, Heinecke JW. Caloric restriction attenuates dityrosine cross-linking of cardiac and skeletal muscle proteins in aging mice. Arch Biochem Biophys. 1997;346:74-80.
- Judge S, Jang YM, Smith A, Hagen T, Leeuwenburgh C. Age-associated increases in oxidative stress and antioxidant enzyme activities in cardiac interfibrillar mitochondria: implications for the mitochondrial theory of aging. FASEB J. 2005;19:419-421.
- Halliwell B, Gutteridge JMC. Free Radicals Biology and Medicine. Clarendon Press, Oxford. 1999.
- Baynes JW, Thorpe SR. The role of oxidative stress in diabetic complications. Current Opinion Endocrinology Diabetes Obesity. 1996;3:277-284.
- Murray J, Taylor SW, Zhang B, Ghosh S. Oxidative damage to mitochondrial complex I due to peroxynitrite. J Biol Chem. 2003;278:37223-37230.
- Yang J, Liu XS, Bhalla K, Kim CN, Ibrado AM, Cai J, et al. Prevention of apoptosis by Bcl-2: release of cytochrome c from mitochondria blocked. Sci. 1997;275:1129-1132.
- Kluck RM, Bossiwetzel E, Green DR, Newmeyer DD. The release of cytochrome c from mitochondria: a primary site for Bcl-2 regulation of apoptosis. Sci. 1997;275:1132-1136.
- Ikeda H, Koga Y, Oda T, Kuwano K, Nakayama H, Ueno T, et al. Free oxygen radicals contribute to platelet aggregation and cyclic flow variations in stenosed and endothelium injured canine coronary arteries. J Am Coll Cardiol. 1994;24:1749-1756.
Citation: Egwim EC, Yakubu G (2019) Effects of High and Low Glycemic Load of Different Nigerian Food Forms on Rats Brain and Heart Mitochondrial Integrity. Biochem Anal Biochem 8:377. doi: 10.35248/2161-1009.19.8.377.
Copyright: © 2019 Egwim EC, et al. This is an open-access article distributed under the terms of the Creative Commons Attribution License, which permits unrestricted use, distribution, and reproduction in any medium, provided the original author and source are credited.