PMC/PubMed Indexed Articles


Indexed In
- Open J Gate
- Genamics JournalSeek
- Academic Keys
- JournalTOCs
- CiteFactor
- Ulrich's Periodicals Directory
- Access to Global Online Research in Agriculture (AGORA)
- Electronic Journals Library
- Centre for Agriculture and Biosciences International (CABI)
- RefSeek
- Directory of Research Journal Indexing (DRJI)
- Hamdard University
- EBSCO A-Z
- OCLC- WorldCat
- Scholarsteer
- SWB online catalog
- Virtual Library of Biology (vifabio)
- Publons
- Geneva Foundation for Medical Education and Research
- Euro Pub
- Google Scholar
Useful Links
Share This Page
Journal Flyer
Open Access Journals
- Agri and Aquaculture
- Biochemistry
- Bioinformatics & Systems Biology
- Business & Management
- Chemistry
- Clinical Sciences
- Engineering
- Food & Nutrition
- General Science
- Genetics & Molecular Biology
- Immunology & Microbiology
- Medical Sciences
- Neuroscience & Psychology
- Nursing & Health Care
- Pharmaceutical Sciences
Research Article - (2020) Volume 11, Issue 12
Effect of Varieties and Fungicide Application Frequencies on Late Blight (Phytophthora infestans) Disease Development and Fruit Yield of Tomato in North Western Tigray, Ethiopia
Geray Hagos1*, Kiros Meles2 and Hadush Tsehaye32Department of DCHS, College of Dryland Agriculture and Natural Resources, Mekelle University, Ethiopia
3Shire Maytsebri Agricultural Research Center, Ethiopia
Received: 06-Nov-2020 Published: 26-Dec-2020, DOI: 10.35248/2157-7471.20.12.231
Abstract
Diseases like late blight are among the major constraints that limit tomato production in most tomato growing regions. Field experiment was conducted in North Western Tigray in 2018 main season with objectives: to investigate the effect of varieties and fungicide application frequencies on late blight disease development and tomato fruit yield. The treatments consisted of four tomato varieties (Melkashola, Melkasalsa, Sirinka-1 and Gelilema) and five application frequencies of the fungicide Matco 72% WP including the control. The experiment was laid out in a split plot design with three replications. Results indicated that integration of varieties and fungicide spray frequencies significantly reduced late blight disease development and maximizes tomato fruit yield. Melkasalsa variety is found better with lowest disease incidence (36.87%), disease severity (26.83%), AUDPC (587.5% days), DPR (0.0604unit per days) and highest marketable (50.05 tha-1) and highest total fruit yield (54.63 t ha-1) when sprayed four times. The highest percent disease incidence (81.50%), disease severity (74.60%), AUDPC (1558.3% days) and Disease Progress Rate (DPR) (0.1074 units per day) were obtained from untreated Gelilema variety. The lowest fruit yield (35.02 tha- 1) was harvested from none sprayed Gelilema variety. Highest MRR of 3058% was obtained on Melkasalsa variety treated thrice. Thus it is recommended to use 3 sprayings of the fungicide Matco 72% WP at 10 days interval where the variety Melkasalsa is to be used in the study area. However, other management practices should be employed to this variety to confirm its resistance ability and to maximize its fruit yield in the presence of the disease in main season.
Keywords
AUDPC; PSI; Late blight; Matco 72% WP spray; Tomato varieties
Introduction
Tomato (Solanum lycopersicum L.) is an important vegetable crop grown around the world and is the second next to potato [1]. Economically, it is the fourth most important crop in the world after rice, wheat, and soybean [2] and ranking 8th in annual national production in Ethiopia [3]. It is a source of minerals, vitamins, lycopene and health benefits in reduce cancer and heart disease [4] and most commonly produced under off season but rare in main season when its demand and price sharply rises [5]. Its production in Ethiopia is 27,774.54 tons from area of 5235.19 ha and productivity of 5.31 t ha-1 [6]. Production and area coverage is reduced by 590.29 tones and 1063.44ha as compared to the past cropping season and is far below the average of major producers in Africa [7]. Tigray region shares area of 769.42 ha and particularly North western Tigray more than 495.55 ha area with total yield of 3,367 tons were reported [6]. Growers opt to shift their irrigated tomato field with other field crops in the main season. Despite of its importance as income generating for small scale farmers especially in main season, its production and productivity is affected by different biotic and abiotic factors, such as pests and disease, weeds, lack of improved and adapted varieties, harsh environmental conditions, inadequate knowledge of production and management, and poor marketing system are the major ones [8]. More than 200 known diseases and pests are affecting tomatoes worldwide among which late blight is the most devastating foliar and fruit diseases in the highlands of sub-Saharan Africa, and in Ethiopia [9-12]. It can cause up to 90% of crop losses in cool and wet weather conditions, most prevalent during the rainy season and cause yield losses of up to 100% [2] and fruit losses up to 30-60% [13]. Fungicides (protectant and systemic) application integrated with resistant crop genotypes has perhaps been reported as the most effective for management of this disease in temperate countries [14]. However, growers including in the study area use whatever fungicide available alone frequently up to harvesting and some only once in the crop growing period with unknown dose, application time and application frequencies for all tomato varieties irrespective of their resistance ability to the disease. Consequently, the promiscuous use of fungicides might bring adverse effects on human, animal health, environment and lead to development of resistance by the pathogen. Hence, it is needed to integrate fungicide with varying application frequencies and crop genotypes of unlike resistance level to the disease to minimize the negative impact of the chemical and prevent resistance by the pathogen. Therefore, the current research was carried out with the following objective: 1) To evaluate the effect of host plant resistance and fungicide spray frequencies on tomato late blight disease development in main seasons; 2) To investigate the effects of host plant resistance and fungicide application frequencies on fruit yield and yield components of tomato; and 3) To elucidate the economic profitability of the management practices for tomato late blight disease.
Materials and Methods
Description of the study area
Experiment was conducted at Shire Maytsebri Agricultural Research Center, in Adigdad experimental site, Tahtay-Koraro Wereda, North Western Tigray, during the 2018 rainy season. It is located at 140 10’ 30 " N latitude and 38º 10’ 30" E longitude. The site is laid at an altitude of 1800 m.a.s.l. Climatic zone of the study areas belong to Weyna-Dega agro-climatic zone and unimodal pattern rainfall with main rainy season extended from June to September with mean annual temperature of 24ºc and mean annual rainfall of 1000mm.
Experimental materials
Four tomato varieties ((Melkasalsa, Gelillema, Sirinka-1 and Melkashola), which currently under production and differed in their resistance levels to late blight disease were used as experimental test crop. Matco 72% WP (Metalaxyl 8% WP + Mancozeb 64%) as a foliar spray was used at the manufacturer’s label dose of 2.5 kg ha-1 and spray frequency at 10 day interval with five spray frequencies. Brief description of the agronomic and morphological characteristics of the tomato varieties are tabulated here under (Table 1).
| Varieties Name | Year of release | Breeder/ | Growing | Maturity date | yield (t /ha) | Fruit color | Fruit shape | Reaction | |
|---|---|---|---|---|---|---|---|---|---|
| Maintainer | altitude | RY | FY | to LB | |||||
| Melkashola | 1997/8 | EARO/NZARC | 700-2000 | 100-120 | 43 | 14-18 | Light red | pear | S |
| Melkasalsa | 1997/8 | EARO/NZARC | 700-2000 | 100-110 | 45 | 13-17 | - | pear | MR |
| Sirinka-1 | 2006 | SRARC/ARARI | 800-2000 | 95-100 | 38.2 | 14.4 | Light red | round | Unknown |
| Gelilema | 2015 | MARC/ EIAR | 500-2000 | 80-92 | 50 | - | Cherry | Oval | Unknown |
Table 1: Description of the agronomic characteristics of tomato varieties employed in the experiment.
Experimental design and treatment combinations
Seed was obtained from Shire Maytsebri Agricultural Research Center and the standard method of seedling raising method recommended by the Melkassa Agricultural Research Center [15-17] was used and transplanted in to the experimental field 28 days after sowing with a spacing of 70 cm and 30 cm between rows and plants. Treatments are arranged in Split plot design and replicated thrice with plot size of 9.45 m2. Recommended standard fertilizer rate of 150 kg DAP ha-1 was applied in rows at transplanting and 100 kg urea per ha-1. Fungicide application was started immediately during the onset of the first disease symptom in 31 days after transplanting and Disease assessments 7 days later (38 DAT) and continued according to the spray schedule for each treatment at 10 days interval. The experiment relied entirely on natural infection because the site was hot spot area for late blight disease during the rainy season.
Data collection
1. Disease Severity (DS): Disease severity was recorded from the five pre-tagged plants (five leaves from each plant) in the middle three rows of each plot starting from 7 days after the first appearance of the disease symptoms to determine the disease severity over a time [18] for every seven days for a period of six weeks. It was ratted using a 0 to 9 disease scoring scale; where, 1=no infections; 2=1-10% leaf area infected; 3=11- 20% leaf area infected; 4=21-30% leaf area infected; 5=31-40% leaf area infected; 6=41-50% leaf area infected; 7=51-60% leaf area infected; 8=61-70% leaf area infected; and 9=71-100% leaf area infected and converted in to PSI as described by Horneburg et al. [19].
PSI = (Sum of numerical ratings/(Number of plants scored × maximum disease score on scale)) × 100
2. Area under disease progress curve (AUDPC): AUDPC was computed from PSI value for each plot as described [20,21] and used for comparisons of susceptibility groups of the tested varieties.
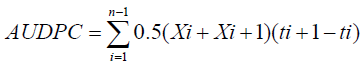
Where, n= is the total number of disease assessments, ti is the time of the ith assessment in days from the first assessment date and xi is the PSI of disease at the ith assessment. AUDPC was expressed in %-days because severity (x) is expressed in percent and time (t) in days.
3. Disease progress rate (DPR): Logistic, ln [(Y/1-Y)] and Gompertz, -ln [-ln(Y)] [22] models were compared for the estimation of disease progression parameters from each treatments and the Logistic model was found fit to the data. The goodness of fit of the models was tested based on the magnitude of the coefficient of determination (R2). The transformed data of disease severity were regressed over time to determine the model. The model was then used to determine the apparent rate of disease increase.
4. Days to 50% flowering and fruit setting: This was recorded as the number of days from transplanting until 50% of plants have at least one open flower and least one fruit per plant respectively. Fruits number, number of fruit cluster and number of branches per plant was counted and recorded from five plants sampled in the three middle rows of each plots. Marketable, Unmarketable and Total fruit yield (t/ha) was measured at each harvesting and converted in to hectare.
Statistical analysis
Data on late blight disease severity, AUDPC, DPR and various agronomic data collected were subjected to analysis of variance (ANOVA) using Gen Stat-16 statistical software programs and least significance difference (LSD) was used for the mean comparison at 5% probability level. Correlation analysis was used to examine the relationship between disease development and fruit yield and related parameters of the crop.
Relative yield loss (%) and yield increase in fruit yield
The relative percent yield loss and yield increase over the untreated plot were obtained using the formula suggested by Robert et al. [23].
Relative yield loss (%) = ((Yield of best treated –Yield of untreated plot)/Yield of best treated plot) × 100
Yield increase over control (%) = ((Yield of Treated plot –Yield of Untreated plot)/Yield of Treated plot) × 100
Cost and benefit analysis
A simple cost-benefit analysis was computed for each treatment using the formula of partial budget analysis [24] to determine the profitability of tomato late blight management through combination of varieties and fungicide sprays at different frequencies. It was analyzed by considering the variable cost for the respective treatments. Price of fruits per kilogram was obtained from the local market (18.5 Birr/kg). Cost-benefit analysis of each fungicide schedule was done to evaluate the economic benefits expected using the farm gate price of tomato at the time of harvest. MRR was calculated using:
Marginal rate of return (MRR) = Difference in net income compared with control/Difference in input cost compared with control
Results and Discussion
Disease development: Late blight disease severity
The interaction effect of tomato varieties and spray frequency showed highly significant (p < 0.001) difference on the percent severity index at all assessment dates except at the intial date when only the main effects were significant but their interaction did not (38 DAT). Melkasalsa variety had scored lowest disease record in all spray frequencies including in the untreated plots. In the final date of assessment (73 DAT), The highest percent severity index was recorded on the untreated Gelilema, and the least on moderately resistant variety Melkasalsa than the variety X spray frequency treatment combinations (Table 2). In line with Abhinandan and Binyam [25,26] who found that frequently applied fungicides by far reduced disease severity as compared to the less frequently sprayed fungicides and unsprayed plots of tomato. The study of Namanda et al. [27] also noted that the combined uses of fungicide and resistance varieties have evolved as one of the most important options in the management of the disease.
| Varieties of Sprays | late blight percent severity index (%) in all dates | |||||||
|---|---|---|---|---|---|---|---|---|
| 45 DAT | 52 DAT | 59 DAT | 66 DAT | Final | AUDPC | DPR | ||
| Melkashola | Control | 15.9k | 28.2j | 46.2i | 50.9i | 59.53j | 1213.6j | 0.0977j |
| Once | 13.0ij | 23.7h | 38.7gh | 42.3h | 50.57i | 1019.1hi | 0.0857gh | |
| Twice | 11.0g | 20.0f | 32.4e | 35.4f | 41.0g | 851.1f | 0.0787fg | |
| Thrice | 9.1cde | 16.7d | 28.6d | 31.1de | 35.63de | 740.5d | 0.0710cde | |
| Four times | 7.77ab | 14.4b | 25.9bc | 27.5bc | 30.07b | 650.7b | 0.0627ab | |
| Melkasalsa | Control | 12.4hi | 21.6g | 36.5f | 39.3g | 47.17h | 949.4g | 0.0854gh |
| Once | 10.6fg | 18.6e | 30.8e | 32.6e | 37.60ef | 793.20e | 0.0787fg | |
| Twice | 9.1cde | 16.2cd | 27.4cd | 29.7cd | 33.57cd | 707.7cd | 0.0726def | |
| Thrice | 7.8ab | 14.2b | 25.3ab | 27.2ab | 30.17b | 641.1b | 0.0683bcde | |
| Four Times | 6.80a | 12.6a | 23.7a | 25.2a | 26.83a | 587.5a | 0.0604a | |
| Sirinka-1 | Control | 16.8k | 31.0k | 51.9k | 58.4k | 67.30l | 1360.0l | 0.1051k |
| Once | 13.9j | 26.3i | 45.0i | 50.8i | 60.00j | 1181.6j | 0.0934ij | |
| Twice | 11.6gh | 22.0g | 38.2fg | 42.5h | 51.20i | 994.9h | 0.0899hi | |
| Thrice | 9.5de | 18.1e | 31.0e | 33.4ef | 40.03fg | 802.3e | 0.0721cdef | |
| Four Times | 8.2bc | 15.5c | 26.7bc | 28.5bc | 31.43bc | 678.5bc | 0.0661abcd | |
| Gelilema | Control | 20.97l | 37.1l | 58.7l | 65.2l | 74.60m | 1558.3m | 0.1074k |
| Once | 16.6k | 30.4k | 49.4j | 55.7j | 63.97k | 1313.3k | 0.0915hij | |
| Twice | 12.9ij | 24.1h | 40.2h | 44.5h | 52.43i | 1057.8i | 0.0808g | |
| Thrice | 9.8ef | 18.3e | 30.5e | 32.9e | 46.87h | 827.8ef | 0.0734ef | |
| Four Times | 8.4bcd | 15.3bc | 26.9bcd | 29bcd | 40.10fg | 720.8cd | 0.0655abc | |
| LSD 5% | 1.113 | 1.106 | 1.916 | 2.271 | 2.611 | 932.46 | 0.08 | |
| CV (%) | 5.8 | 3.2 | 3.2 | 3.5 | 3.6 | 2.8 | 5.4 | |
Table 2: Interaction effect of treatments on final late blight disease development during 2018.
Area under disease progress curve (AUDPC) (% days)
The interaction effect of varieties and fungicide spray frequencies revealed significant (P ≤ 0.001) variation in the magnitude of the AUDPC. AUDPC value was maximum on none sprayed Gelilema and smallest on Melkasalsa tomato variety when treated four times (Table 2). All unsprayed varieties scored maximum disease development, however, lowest in Melkasalsa variety. In agreement with the report of Mesfin and Ayda [28,29] who found lowest AUDPC values of late blight disease on moderately resistant potato varieties when supplemented with fungicide treatments in the wet season. Previous studies also reported that the highest value of AUDPC resulted from the highest disease development on untreated with any combinations of crop varieties and fungicide applications [20,26,30].
Disease progress rate (unit per days)
Comparisons among the growth models on disease progress rate of late blight for four tomato varieties with five fungicide spray frequencies were made and the logistic model was found appropriate to determine the final rate of disease severity for this study as the coefficient of determination (R2) was higher for logistic model in all the varieties than the Gompertz model while the error mean square for logistic model was lower than that of Gompertz model. Therefore, comparisons of the rate among treatments were made based on logistic model. The interaction effect of treatments revealed significant (p ≤ 0.05) variation in late blight disease progress rate. Disease progress rate was highest on unsprayed Gelilema and Sirinka-1 variety than the other treatments. Whereas, development rate of the disease was significantly reduced on Melkasalsa variety times treated with Matco WP 72% at 10 days interval (Table 2). All tomato varieties remained statically similar when treated thrice and four times with Matco 72WP fungicide. However, all the fungicides sprayed at weekly interval was reduced the progress rate significantly. As reported by Bekele [31] the frequent application of fungicide retards rate of potato late blight progress in the field.
Growth, fruit yield and related components
Days to 50% flowering and fruit setting
Main treatment effect (varieties and spray frequencies) exhibited a very highly significant (p≤0.001) difference among varieties and fungicide spray frequencies with regard to days to 50% flowering. Gelilema variety took extended time to reach 50% flowering, whereas, Melkashola variety attained early (Table 3). None sprayed plots were delayed more than one week compared to Four times sprayed plots. The result is in line with [32] who reported variations in days to flowering among tomato genotypes. The interaction effect of main treatments revealed significant (p<0.05) difference on 50% fruit setting date. Longer time for 50% fruit setting was observed on untreated Gelilema and shorter period on Melkashola variety when treated four times with Matco 72% WP (Table 4). Frequently sprayed fungicide might enhance vegetative growth and facilitates flowering and fruit setting.
| Tomato yield and fruit Parameters During 2018 main season | ||||
|---|---|---|---|---|
| Tomato Varieties | 50% DF | NBPP | NFCPP | UMFY |
| Melkashola | 33.87a | 11.23c | 14.35b | 6.68b |
| Melkasalsa | 38.27c | 10.17b | 16.65a | 5.57a |
| Sirinka-1 | 36.80b | 9.43a | 12.73c | 6.76b |
| Gelilema | 38.60c | 9.37a | 12.86c | 5.90a |
| LSD (5%) | 1.104 | 0.725 | 0.703 | 0.33 |
| Spray Frequency | ||||
| Control | 42.50d | 8.88a | 10.15a | 7.50c |
| Once treated | 38.50c | 9.33a | 12.23ab | 6.68b |
| Twice treated | 36.17b | 9.58a | 13.80b | 6.35b |
| Thrice treated | 33.67a | 11.04b | 16.53c | 5.41a |
| Four Times treated | 33.58a | 11.42b | 18.02c | 5.21a |
| LSD (5%) | 1.934 | 1.352 | 2.713 | 0.44 |
| Var* SF | Ns | Ns | Ns | Ns |
| Mean | 36.88 | 10.05 | 14.14 | 6.23 |
| CV (%) | 2.8 | 7.1 | 10.2 | 11.7 |
Table 3: Effect of varieties and fungicide spray frequencies on tomato growth and yield parameters.
Number of branches per plant
Branch number per plant was highly significantly (P ≤ 0.001) affected by the main effect treatments. Melkasholla scored highest branch numbers and lowest from variety Gelilema (Table 3). The variation in branches number is supported by the findings [33-36].
With regard to spray frequencies, Branch number linearly increased as spray frequencies increased. This is in accord with who stated frequent application of fungicide protect the crop from disease stress and encourages for production of primary and secondary branches as compared to unsprayed once [10].
Marketable, unmarketable and total fruit yield
Unmarketable fruit yield was significantly (p ≤ 0.001) affected by tomato varieties and fungicide application frequencies but their interaction did not. The highest unmarketable fruit yield was obtained on Sirinka-1, Whereas, lowest from Melkasalsa. Untreated plots scored maximum unmarketable yield and the lowest on plots treated four times and similar with thrice sprayed (Table 3). However, the interaction effect treatments revealed significant (p < 0.05) difference on marketable and total fruit yields. The lowest marketable and total fruit yield was recorded on unsprayed Gelilema, whereas, highest from four times treated Melkasalsa variety (Table 4). This result is in agreement with Dillard et al. [37] who stated fungicide applications reduces disease intensity, at the same time maximizes tomato fruit yields. Studies reported that fungicides significantly reduced disease severity and gave increased yield over the control [16,26]. Many tomato researchers [33,34,38] ranged total fruit yield between 6.46 and 82.50 t ha-1. In analogous with Rida et al. and Rida et al. [39,40] who indicated noticeable differences in fruit yield of tomato varieties. The study of Shushay et al. [41] also noted Melkasalsa variety showed fruit yield superiority over Melkashola variety in fruit yield.
| Treatmets During 2018 Main cropping season | |||||
|---|---|---|---|---|---|
| Tomato Variety | Spray Frequency | 50% FS | FNPP | MFY (tha-1) | TFY (tha-1) |
| Melkashola | Control | 51.67fgh | 39.70abc | 31.98c | 39.98c |
| One time | 49.00def | 47.80ef | 34.04de | 41.12cd | |
| Two times | 45.67bc | 52.73gh | 36.74f | 43.58e | |
| Three times | 44.33ab | 60.67i | 42.01h | 47.84f | |
| Four times | 42.00a | 60.53i | 45.99j | 51.65g | |
| Melkasalsa | Control | 58.67ij | 42.7cd | 34.50e | 41.50d |
| One time | 56.33i | 54.13h | 35.99f | 41.91d | |
| Two times | 49.00def | 59.03i | 39.31g | 44.70e | |
| Three times | 50.67efgh | 66.33j | 46.12j | 51.10g | |
| Four times | 48.00cde | 64.8j | 50.05k | 54.64h | |
| Sirinka-1 | Control | 52.67gh | 38.77ab | 30.55b | 38.38b |
| One times | 52.67gh | 41.53bc | 33.43d | 40.91cd | |
| Two times | 50.67efgh | 45.93de | 36.57f | 43.48e | |
| Three times | 47.00bcd | 53.57gh | 41.93h | 48.02f | |
| Four times | 48.00cde | 55.3h | 45.36j | 50.86g | |
| Gelilema | Control | 59.33j | 37.23a | 27.84a | 35.02a |
| One times | 57.33ij | 41.27bc | 30.89b | 37.14b | |
| Two times | 53.33h | 45.6de | 33.81de | 40.06c | |
| Three times | 50.33efg | 52.63gh | 39.12g | 43.87e | |
| Four times | 48.33cde | 50.73fg | 43.95i | 49.03f | |
| LSD (5%) | 2.944 | 3.342 | 1.045 | 1.33 | |
| Mean | 50.75 | 50.54 | 38 | 44.23 | |
| CV (%) | 3.2 | 3.9 | 1.7 | 1.8 | |
Table 4: Effect of integrated management of late blights disease on fruiy yield parameters of tomato.
Number of fruits and fruit clusters per plant
Number of fruit clusters per plant were significantly (p ≤ 0.001) affected by main effect of variety and spray frequencies, However, fruit number per plant significant (p ≤ 0.05) influenced by interaction effect main treatments. The highest fruit clusters per plant were found from Melkasalsa variety and lowest in sirinka-1 variety. Concerning spray frequencies, the lowest and highest numbers of fruit clusters per plant were obtained from unsprayed control plots and four times treated plots, respectively (Table 3). Many authors [42,43] reported that the mean number fruit cluster per plant lay between 4 to 16 fruits. The highest fruit numbers per plant of were recorded from thrice and four times treated plots of Melkasalsa (Table 4). Similarly, the least fruit number per plant was found from control plots of Gelilema but at par with untreated plots of Sirinka-1 and Melkashola varieties. In line with the finding of Shushay et al. [41] who confirmed as Melkasalsa variety showed higher fruit number and fruit cluster per plant over Melkashola. The mean number of fruits per plant could vary between 4.46 to 98.30 as reported by Eshteshabul et al [44]. The present study was agreed with results of Emami and Emami [45,46] who reported wide range of differences such as (33-79) and (4-97) in number of fruits per plant among the tested tomato genotypes respectively.
Association of late blight epidemics with tomato fruit yields
The association between disease and yield parameters was examined using simple correlation analysis. Determined Pearson correlation coefficients (r) were used as indices for strength of the association. Tomato fruit yield (Total and marketable, NFPP and NFCPP) fruit were found strong and negatively correlated with all disease parameters of late blight. Likewise, total and marketable fruit yields were posetively correlated with all growth and fruit parameters of tomato (Table 5). It is in accord with findings [47] who reported that the associated disease parameters had a negative impact on yield parameters. As stated by Regassa et al. [48] highly significant and positively association between yield related parameters and fruit yield for nine evaluated tomato varieties.
| FPSI | AUDPC | DPR | MFY | TFY | UMFY | NFPP | NFCPP | |
|---|---|---|---|---|---|---|---|---|
| AUDPC | .99*** | |||||||
| PDIf | .84*** | .86*** | ||||||
| DPR | .91*** | .90*** | ||||||
| MFY | -.91*** | -.93*** | -.85*** | |||||
| TFY | -.88*** | -.91*** | -.80*** | .99*** | ||||
| UMFY | .74*** | .74*** | .82*** | -.74*** | -.64*** | |||
| NFPP | -.87*** | -.88*** | -.75*** | .88*** | .86*** | -.70*** | ||
| NFCPP | -.86*** | -.88*** | -.81*** | .87*** | .84*** | -.76*** | .87*** | |
| NBPP | -.58*** | -.57*** | -.58** | .61*** | .60*** | -.45* | .58*** | .59*** |
Table 5: Correlation analysis of late blight disease epidemics and fruit yield of tomato under main season.
In the regression analysis both AUDPC and TFY served as independent and dependent variable, respectively. Linear regression of the AUDPC was used to predict the yield loss in tomato (Figure 1). This is because AUDPC linear regression is better analytical model to indicate the relationship of yield loss with the disease effects. Thus, in linear regression of the area under disease progress curve was used for predicting the yield loss in tomato for 2018 main cropping season. The coefficient of determination (R2) value indicated that 81.6% the variation of yield was explained by AUDPC. This regression graph showed that for every one unit increase in AUDPC there was 0.01768 unit (tons) loss in yield of tomato genotypes, on the other hand, 81.6% of the variation in this experiment can be accounted by the equation.

Figure 1: Linear regression of tomato fruit yield and AUDPC during 2018 main cropping season. TFY: Total Fruit Yield; AUDPC: Area under Disease Progress Curve.
Relative yield loss and yield Increase in fruit yields
The losses inflicted on tomato fruit yields for different foliar spray frequencies were calculated relative to the yield of maximally protected plots with the fungicide Matco 72% WP at 10 days interval. The highest fruit yield losses of 36.65% was calculated from unsprayed of Gelilema compared to the best protected plots with the fungicide Matco 72% WP in each variety. The highest yield increment of best treated plots was calculated as 36.54% from variety Gelilema, as compared to the untreated plots of each variety (Table 6). Approximately 30% – 60% fruit yield loss of is accounted due to late blight disease as stated by Nyakanga et al. [13]. In line with [49] also reported yield loss of 38% - 53% due to late blight disease on an unsprayed control plot of potato variety. About 6.5%- 70% fruit yield losses due to late blight in Ethiopia were reported by Bekele et al. [50] on improved tomato varieties.
| Treatments | During 2018 main cropping season | |||
|---|---|---|---|---|
| Variety | Spray frequency | MFY (t/ha) | RYL (%) | CYI (%) |
| Melkashola | Control | 31.98 | 30.46 | 0 |
| Once | 34.04 | 25.98 | 6.05 | |
| Twice | 36.74 | 20.11 | 12.95 | |
| Thrice | 42.01 | 8.65 | 23.87 | |
| Four times | 45.99 | 0 | 30.46 | |
| Melkasalsa | Control | 34.5 | 31.07 | 0 |
| Once | 35.99 | 28.09 | 4.14 | |
| Twice | 39.31 | 21.45 | 12.23 | |
| Thrice | 46.12 | 7.85 | 25.19 | |
| Four time | 50.05 | 0 | 31.06 | |
| Sirinka-1 | Control | 30.55 | 32.64 | 0 |
| Once | 33.43 | 26.3 | 8.62 | |
| Twice | 36.57 | 19.37 | 16.46 | |
| Thrice | 41.93 | 7.56 | 27.14 | |
| Four times | 45.36 | 0 | 32.64 | |
| Gelilema | Control | 27.84 | 36.65 | 0 |
| Once | 30.89 | 29.71 | 9.87 | |
| Twice | 33.81 | 23.07 | 17.65 | |
| Thrice | 39.12 | 10.98 | 28.83 | |
| Four times | 43.95 | 0 | 36.54 | |
Table 6: Relative yield losses by tomato late blight disease and fruit yield increase among treatments.
Economic analysis
Only the marketable fruit yield was considered for sale and the cost of water was assumed to be zero. Partial budget analysis showed that all Matco 72% WP foliar spray frequencies used on four tomato varieties gave high gross field benefit and marginal rate of return. The maximum total gross marketable yield benefit of ETB 895,609.8 and 825,698.6 ha-1 was obtained on Melkasalsa when treated four times and thrice with Matco 72% WP, respectively compared to the other treatment combinations (Table 7). The highest MRR of 3058% in comparison with unsprayed plots was obtained on moderately resistant Melkasalsa tomato variety sprayed thrice plots followed by four times treated Gelilema (2905%). In line with Shiferaw and Tesfaye [49] who found highest MRR from moderately resistant potato variety when treated thrice with Matco 72% fungicide.
| Treatments During 2018 Main cropping season | |||||||
|---|---|---|---|---|---|---|---|
| Tomato | Spray | MFY | SR | TVC | NI | Dominance | MRR |
| Variety | frequency | (kg ha-1) | (ETB ha-1) | (ETB ha-1) | (ETB ha-1) | (%) | |
| MSH | Control | 31980 | 591630 | 20400.4 | 5,71,229.60 | N | 0 |
| Once | 34040 | 629740 | 22749.6 | 6,06,990.40 | N | 1505 | |
| Twice | 36740 | 679690 | 24420.6 | 6,55,269.40 | N | 2090 | |
| Thrice | 42010 | 777185 | 27521.4 | 7,49,663.60 | N | 2505 | |
| Four times | 45990 | 850815 | 30315.2 | 8,20,499.80 | N | 2514 | |
| MSA | Control | 34500 | 638250 | 20400.4 | 6,07,934.80 | D | 0 |
| Once | 35990 | 665815 | 22749.6 | 6,43,065.40 | D | 1495 | |
| Twice | 39310 | 727235 | 24420.6 | 7,02,814.40 | D | 2360 | |
| Thrice | 46120 | 853220 | 27521.4 | 8,25,698.60 | N | 3058 | |
| Four times | 50050 | 925925 | 30315.2 | 8,95,609.80 | D | 2901 | |
| SIR-1 | Control | 30550 | 565175 | 20400.4 | 5,44,774.60 | D | 0 |
| Once | 33430 | 618455 | 22749.6 | 5,95,705.40 | D | 2168 | |
| Twice | 36570 | 676545 | 24420.6 | 6,52,124.40 | D | 2670 | |
| Thrice | 41930 | 775705 | 27521.4 | 7,48,183.60 | D | 2856 | |
| Four times | 45360 | 839160 | 30315.2 | 8,08,844.80 | D | 2663 | |
| GEL | Control | 27840 | 515040 | 20400.4 | 4,94,639.60 | D | 0 |
| Once | 30890 | 571465 | 22749.6 | 5,48,715.40 | D | 2301 | |
| Twice | 33810 | 625485 | 24420.6 | 6,01,064.40 | D | 2647 | |
| Thrice | 39120 | 723720 | 27521.4 | 6,96,198.60 | D | 2830 | |
| Four times | 43950 | 813075 | 30315.2 | 7,82,759.80 | D | 2905 | |
*Price of fruit per kilogram was 18.50ETB at the time of fruit selling in 2018.
Table 7: Partial budget analysis for integrated management of tomato late blight disease.
Conclusion
The cultivated tomato is the world’s second most important vegetable after potato in terms of its production. Tomato Late blight (Phytophthora infestans) is one of the limiting biological factors for its production in warm humid areas in the world and in Ethiopia. The current study was conducted at Shire Maytsebri Agricultural Research Center, north western Zone of Tigray, Northern Ethiopia, during 2018 main cropping season. Integrated management of late blight disease with resistant/moderately resistant tomato varieties and timely fungicide Matco 72% WP spray frequencies seems to have affected the disease development and maximizes fruit yield of tomato. The result of the study indicated that, even under the pressing problem of the disease in the rainy season, a moderately resistant tomato varieties, like Melkasalsa combined with three time spray frequencies at 10 days interval and susceptible tomato variety like Gelilema sprayed four times significantly manage late blight disease and gave the highest monetary benefit as compared to the other treatments and the control. In general, during heavy rainy seasons, it is difficult to manage the disease completely, but it could be suppressed through integration of tomato varieties with foliar fungicide applications. The overall study result showed that production of tomato even in main cropping season under high disease intensity is possible if growers integrate resistant/ moderately resistant tomato genotype with timely application of recommended fungicids.
Recommendations
Melkasalsa variety appeared relatively resistant to late blight with thrice spray applications and is the promising variety as it managed the disease, gave maximum net benefit and MRR (%) than the remaining combinations. Therefore, all tomato growers such as farmers, private investors, and state enterprises must adopt integrated management practices to restrict the development of late blight and for sustainable tomato production in the study area and in similar agro-ecologies. However, further extensive studies have to be conducted to come up with concrete conclusion and recommendations on the possibility of summer tomato production with fungicide spray applications and other management practices under the challenge of the disease.
Acknowledgements
The research was part of the postgraduate research at Mekelle University. I would like to thank Aksum University for providing me the required financial support for the research work; to Mekelle University for facilitating and advising the overall research works to the end of the study period. I would like to convey a special thanks to Shire Maytsebri Agricultural Research Center for allowing me the site for the experiment.
REFERENCES
- Mutschler M, Zitter T, Bornt C. Tomato lines for the northeast combining early blight and late blight resistance. Vegetable Program. New York. 2006;14853.
- Nowicki M. Late blight of tomato. In: Translational genomics for crop breeding. Biotic Stress. 2013;1:241-265.
- Derbew B, Ali M, Amina JG. Yield and quality of indeterminate tomato (Lycopersicon esculentum Mill.) varieties with staking methods in Jimma. Sing J Sci Res. 2012;2(2):33 - 46.
- Soares JAP, Farias LM. Efeito do licopeno do tomate na prevenção do câncer de próstata. Revista Interdisciplinar Novafapi. 2012;2: pp. 50-54
- Tsedeke A. Focusing on agricultural research to address development needs: Direction for agricultural research in Ethiopia. Addis Ababa, Ethiopia. 2007.
- CSA, 2017/2018. Report on area and production of major crops in Ethiopia, Addis Ababa. 2017;1:13-25.
- FAOSTATof the United Nations. Production of tomatoes (from pick lists: Crops/World Regions/Production Quantity). 2017.
- Tewodros M, Negasi T. Evaluation of improved tomato (Lycopersicon esculentum Mill.) varities. 1998.
- Sengooba T, Hakiza JJ. The current status of late blight caused by Phytophthora infestans in Africa, with emphasis on eastern and southern Africa. Proc. Global Initiative on Late Blight Conference. 1999.
- Mohammed A, Negeri M, Selvaraj T. Field Evaluation of New Fungicide, Victory 72 WP for Management of Potato and Tomato Late Blight (Phytophthora infestans (Mont) de Bary) in West Shewa Highland, Oromia, Ethiopia. J Plant Pathol Microbiol. 2013;4-8.
- Gemechis AO, Struik PC, Emana B. Tomato production in Ethiopia: constraints and opportunities. Tropentag 2012, International Research on Food Security, Natural Resource Management and Rural Development. Resilience of Agricultural Systems against Crises: Book of Abstracts. 2012;19:373.
- Getachew G. Integrated Management of Tomato (Solanum Lycopersicum L.) Late Blight [Phytophthora Infestans (Mont.) De Bary] through Host Plant Resistance and Fungicide Application in Gamo Gofa Zone, Southern Ethiopia (Doctoral dissertation, Haramaya University). 2017.
- Nyakanga RO, Wien HC, Olanya OM, Ojiambo PS. Farmer cultural practices and management of potato late blight in Kenya: Implications for development of integrated disease management. Int J Pest Manag. 2004;50(2):135-144.
- Olanya OME, Adipala JJ, Hakiza JC, Kedera P, Ojiambo JM, Mukalazi G, et al. Epidemiology and population dynamics of Phytophthora infestans in Sub- Saharan Africa: progress and constraints. Afr J Crop Sci. 2001;9:181-193.
- MoA (Ministry of Agriculture). Animal and plant health regulatory directorate crop variety register. Addis Ababa, Ethiopia. 2012;15:176-180.
- Jiregna TD. Field, greenhouse and detached-leaf evaluation of tomato (Lycopersicon esculentum Mill.) genotypes for late blight resistance. World J Agri Sci. 2014;10(2):76- 80.
- Getachew T, Selamawit K, Yosef A, Mohammed Y, Gashawbeza A. Guide to major vegetable crops production and protection. Amharic Version. Addis Ababa, Ethiopia. 2014.
- Abd-El-Khair G, Karima H, Haggag HE, Nadia GE. Biological control of wilt disease caused by Fusurium oxysporum in fennel under organic farming system. J. Adv. Agric. Res. (Fac. Ag. Saba Rasha). 2004;9:527-538.
- Horneburg, B, Becker HC. Selection for Phytophthora field resistance in F2. Euphytica. 2011;180:357-367.
- Campbell CL, Madden LV. Temporal analysis of epidemics I. Description and comparison of disease progress curves. In: Introduction to Plant disease Epidemiology. 1990;532
- Van der Plank JE. Plant Diseases: Epidemics and Control, Academic Press, New York, London. 1963.
- Abraham T. Increasing Crop Production through Improved Plant Protection, Vol. II, Plant Protection Society of Ethiopia (PPSE), EIAR, Addis Ababa, Ethiopia. 2009.
- Robert GD, James HT. A Biomerical approach. Principles of statistics (2nd ed), New York. USA. 1991.
- CIMMYT (International Maize and Wheat Improvement Center). From agronomic data to farmer recommendations: an economics training manual. Completely revised edition Mexico. 1988.
- Abhinandan D, Randhawa HS, Sharma RC. Incidence of Alternaria leaf blight in tomato and efficacy of commercial fungicides for its control. Ann Biol Sci. 2004;20:211-218.
- Binyam T, Temam H, Tekalign T. Efficacy of reduced dose of fungicide sprays in the management of late blight (Phytophthora infestans) disease on selected potato (Solanum tuberosum L.) varieties, Haramaya, Eastern Ethiopia. J Biol Agri Health Care. 2014;4(20):46 -52.
- Namanda S, Adipala E, Olanya OM, Hakiza JJ, El-Bedewy R, Bhagsari AS. Integration of host resistance and minimum fungicide application for management of Potato late blight in Uganda. Fifth Biennial Conference of the African Crop Science Society (Abstract), Lagos, Nigeria. 2001.
- Mesfin T, Gebre-Medhin W. Impact of farmers’ selected IDM options on potato late blight control and yield. Afr Crop Sci Soc. 2007;8:2091-2094.
- Ayda T. Effect of fungicides and resistant genotypes on severity of potato late blight [Phytophthora infestans (Mont.) de Bary] and yield and yield components at Haramaya, Eastern Ethiopia. M.Sc. Thesis, Haramaya University, Haramay, Ethiopia. 2015.
- Desta M, Yesuf M. Efficacy and economics of fungicides and their application schedule for early blight (Alternaria solani) management and yield of tomato at south Tigray, Ethiopia. J Plant Pathol Microbiol. 2015;6:268.
- Bekele K, Hailu B. Efficacy and economics of fungicide spray in the control of late blight of potato in Ethiopia. J Afr Crop Sci. 2001;9(1):245-250.
- Sinnadurai S. Vegetable Cultivation in Ghana. Accra. 1992;59-60.
- Meseret DR, Ali M, Kassahun B. Evaluation of tomato (Lycopersicon esculentum L.) Genotypes for yield and yield component. Afr J Plant Sci Biotechnol. 2012;45-49.
- Sharma SK, Rastogi KB. Evaluation of some tomato cultivars for seed production under mid hill conditions of Himachal Pradesh. Ann Agri Res. 1993;14(4):494-496.
- Moraru C, Logendra L, Lee T, Janes H. Characteristics of 10 processing tomato cultivars grown hydroponically for the NASA advanced life support (ALS) program. J Food Comp Anal. 2004;17:141–154.
- Ketema BD, Derbew B, Jima N. Evaluation of tomato (Lycopersicon Esculentum Mill.) varieties for growth and seed quality under Jimma condition, Southwestern Ethiopia. Int J Crop Sci Technol. 2016;2(2):69 -77.
- Dillard HR, Johnston SA, Cobb AC, Hamilton GH. Assessment of fungicide benefits for the control of fungal diseases of processing tomatoes in New York and New Jersey. Plant Dis. 1997;81:677-681.
- Lemma D. Tomatoes. Research Experience and Production Prospects. Research Report # 43, Ethiopia Agricultural Research Organization, EARO. 2002.
- Rida AS, Muhammad AA, Ereifij IE, Hussain A. Evaluation of thirteen open pollinated cultivars and three hybrids of tomato (Lycopersicon esculentum Mill.) for yield, physiological disorders, seed production and vegetative growth. Pak J Agri Res. 2002;17(3):290-296.
- Gongolee GAK, Osei MK, Akromah R, Nyadanu D, Aboagye LM. Evaluation of Some Introduced Tomato Cultivars. Hori J Agri Food Sci. 2015;1(1):1-6.
- Shushay C, Haile Z. Evaluation of tomato varieties for fruit yield and yield components. in western lowland of tigray, Humera agricultural research center, Northern Ethiopia. Int J Agri Res. 2014;9(5):259-264.
- Turhan A, Ozmen N, Serbeci MS, Seniz V. Effects of grafting on different rootstocks on tomato fruit yield and quality. Hort Sci. 2011;38(4):142-149.
- Abrar HS, Shams UM, Noor UA, Safdar HS. Evaluation of two nutrient solutions for for growing tomatoes in a non-circulating hydroponics system. J Agri. 2011;27(4):558-567.
- Eshteshabul M, Hakim MA, Amanullah ASM, Ahsanullah ASM. An Assessment of physiochemical properties of some tomato genotypes and varieties grown at Rangnur. J Bang Res pub. 2010;4(3):135-243.
- Emami AM, Homauni R, Razavi E. Introduction of suporier tomato cultivars. Pak J Food Sci Technol. 2013;1:19-26.
- Chernet S, Belew D, Abay F. Genetic variability and association of characters in tomato (Solanum lycopersicon L.) genotype in Northern Ethiopia. Int J Agri Res. 2013;8:67-76.
- Fekede G. Management of late blight (Phytophthora infestans) of potato (Solanum tuberosum L.) through potato cultivars and fungicides in Hararghe highlands, Ethiopia. M.Sc. Thesis, Haramaya University, Haramaya, Ethiopia. 2011.
- Regassa DM, Ali M, Bantte K. Evaluation of tomato (Lycopersicon esculentum Mill.) genotypes for yield and yield components. Afr J Plant Sci Biotechnol. 2012;6:45-49.
- Shiferaw M, Tesfaye T. Effect of Varieties and Fungicides on Potato Late Blight (Phytophthora infestans, (Mont.) de Bary) Management. Hawassa Agricultural Research Center. J Agrotechnol. 2017;7(2):1-3
- Bekele K, Yaynu H. Tuber yield loss assessments of potato cultivars with different levels of resistance to late blight. In: Eshetu Bekele E, Abdulahi A, Yemane A (Eds.), Proceedings, 3rd Annual Conference of CPSE, Addis Ababa. 1996;149-152.
Citation: Hagos G, Meles K, Tsehay H (2020) Effect of Varieties and Fungicide Application Frequencies on Late Blight (Phytophthora infestans) Disease Development and Fruit Yield of Tomato in North Western Tigray, Ethiopia. J Plant Pathol Microbiol 11:531.
Copyright: © 2020 Hagos G, et al. This is an open-access article distributed under the terms of the Creative Commons Attribution License, which permits unrestricted use, distribution, and reproduction in any medium, provided the original author and source are credited.