
Indexed In
- Open J Gate
- Genamics JournalSeek
- Smithers Rapra
- RefSeek
- Directory of Research Journal Indexing (DRJI)
- Hamdard University
- EBSCO A-Z
- OCLC- WorldCat
- Scholarsteer
- Publons
- Geneva Foundation for Medical Education and Research
- Google Scholar
Useful Links
Share This Page
Journal Flyer
Open Access Journals
- Agri and Aquaculture
- Biochemistry
- Bioinformatics & Systems Biology
- Business & Management
- Chemistry
- Clinical Sciences
- Engineering
- Food & Nutrition
- General Science
- Genetics & Molecular Biology
- Immunology & Microbiology
- Medical Sciences
- Neuroscience & Psychology
- Nursing & Health Care
- Pharmaceutical Sciences
Research Article - (2019) Volume 9, Issue 1
Effect of the Light Alkane Content of Natural Gas on the Production of Hydrogen and Coke During the Dry Reform
Solange Maria de Vasconcelos1, Aleksándros El Áurens Meira de Souza2, Monica Santos Araújo2, Marcos Augusto Moraes Silva2, Frederico Augusto Dantas Araújo2, Nelson Medeiros de Lima Filho2 and Cesar Augusto Moraes de Abreu2*2Department of Chemical Engineering, Federal University of Paraiba, Brazil
Received: 29-Jan-2019 Published: 25-Feb-2019, DOI: 10.35248/2090-4568.19.9.191
Abstract
Dry reforming of ethane and propane were carried out with a nickel catalyst (3.92% by weight/γ-Al2O3) to characterize the effects of fed light alkanes on the reforming process of natural gas. Conversions of individual alkanes, representing 74.7% for ethane and 96.0% for propane at 1073 K, promoted hydrogen yields of 43.6% and 66.0%, respectively. The conversion (81%) of a natural gas promoted a 95% hydrogen yield, where about 20% had been obtained from the light alkanes. The reaction steps from alkane dry reforming where hydrogen was produced (alkane cracking) provided carbon formation with a yield of 23%. A kinetics evaluation, based on experimental evidence that indicated two different sets of reaction steps for both ethane and propane processes, enabled the identification of the specific reaction rates of the cracking steps for each alkane. Reaction steps in the reforming process were considered as competitive reactions and the specific cracking reaction rates of both light alkanes were used to quantify the kinetic selectivities of hydrogen, calculated as 95.42% for ethane and 76.99% for propane.
Keywords
Syngas; Ethane; Propane; Dry reforming; Hydrogen; Coke
Introduction
The development of natural gas exploration technologies follows a growing trend of demand for this raw material. Important additional sources of gas from fossil reservoirs, particularly those found with shale, charcoal and sandstone, represent a significant contribution towards meeting this demand [1]. Natural gas reform processes focused on the production of synthesis gas (syngas) and/or hydrogen are important users of this supply and have received special attention in terms of their performance [2-4]. Thus, better operating conditions, active catalysts and suitable reactors have been investigated to obtain high conversion, yield, and selectivity. The use of natural gas not viable to produce liquefied gas represents a potential means to increase hydrogen and/or syngas production [5-9]. On the other hand, the generation of carbon dioxide in different refinery operations such, as regeneration of fluid catalytic cracking units, has increased the interest of the petroleum industry in its use for natural gas conversion by reforming processes [10-12].
Continued attention has been focused on the research on different aspects of the traditional (steam reforming) and alternative (autothermic, dry, tri-reforming,..) routes for converting natural gas into syngas (CO, H2) in order to produce hydrogen and/or liquid fuels such as hydrocarbons free sulphur as well as fuels with high cetane or octane numbers, or oxygenates compounds. In all reforming processes, attention must be paid to the compositional characteristics of the natural gas, as it contains mainly methane, but also has, depending on the origin, a significant percentage of light alkanes with higher hydrogen and carbon contents (C2H6, C3H8, C4H10) that can be processed to produce syngas with high H2/CO ratio [13-15].
In the case of natural gas, as in methane reforming, reaction steps of hydrocarbon cracking provide hydrogen and carbon (coke) deposition on the catalyst [16-18]. The presence of C2-C3 alkanes as minor components of natural gas can increase the amounts of hydrogen and carbon, where the nature of the carbonaceous species during the reform operations can significantly affect the formation of coke. The formation of coke and its role on the catalyst activity has been investigated and compared for both hydrocarbons [19-23]. Catalytic systems of metals promoted with alkaline earth metal oxides (MgO, CaO, BaO) have been used to improve reforming and dehydrogenation activities and to prevent the formation of coke. Situations with implications for reformed natural gas products can be suggested according to the composition of the components of the gas: methane, ethane, and propane [24-26]. For example, in natural gas from different origins there can be various compositions in terms of light alkanes (CH4, C2H6, C3H8): from Slochteren, Nederland, 81.9%, 2.7%, 0.38% vv; from Lacq, France, 69.4%, 2.80%, 1.5% vv; from Hass R'mel, Algeria, 83.5%, 7.0%, 2.0% vv; from Guamaré, Brazil, 85.5%, 8.3%, 3.1% vv. Thus, the knowledge of these compositions can already provide information on potential hydrogen yields, and on the carbon formation that can be promoter of coke formation. Different studies for various natural gas according the origin have researched the compositions with higher content in light alkanes. More recently, studies have been carried out concerning the dry reforming of NG light hydrocarbons, mainly ethane and propane [27-30]. For all these cases, the production of syngas by methane dry reforming has been considered as basis, where the reaction steps, such as methane cracking, reverse reactions of Boudouard, and water gas-shift are included. In this present work, a nickel/γ-alumina supported catalyst was formulated and employed to process light hydrocarbons (alkanes) of natural gas. The formulated catalyst had its activity tested, and its use in the processing of natural gas into syngas by dry reforming was evaluated. Considering propositions of mechanism including four step reactions for the NG light hydrocarbons (ethane, propane) a kinetic evaluation was carried out and the results were expressed in terms of conversion of reactants, product yield and selectivity, and carbon deposition.
Experimental
Catalyst formulation
The catalyst was prepared from nickel nitrate (Ni(NO3)2.6H2O, Sigma) and γ-alumina (γ-Al2O3, Degussa) as the catalytic support. The preparation method was the incipient wetness where the impregnated solution in the support was evaporated to dryness at 393 K for 12 h, and then calcinated at 973 K in an argon flow during 5 h. In the activation step the catalyst was reduced at the same temperature, 973 K, in a hydrogen/argon (200 cm3/min; 50/50 vv) atmosphere for 2 h.
The nickel catalyst was characterized by several methods including atomic absorption spectrophotometry (AAS, Varian AA 220 FS), B.E.T.-N2 (ASAP 2000), Thermal Analysis (TG, DTG, DTA), X-Ray Diffraction (XRD, CuK-alpha radiation, Siemens D5000, JCPD-File n° 10-173, fiche n° 1-35-D 5, 1974), and Infrared Spectra (IRS, FTIR Brucker IFS 66).
Process evaluation
The experiments of the alkane-carbon dioxide reforming processes were carried out with the nickel catalyst (<dp>=212 μm, mcat=80.0 mg) in a fixed-bed reactor (glass reactor, Lb=12.0 cm, length; dr=6.0 mm, diameter). The reactants were fed into the reactor with the gaseous mixtures of C2H6:CO2:Ar=5:20:75 v/v and C3H8:CO2:Ar=2.5:22.5:75 v/v, with flow rates in the range (80-140) × 10-6 m3/min. The operating flow conditions employed are presented in Table 1.
| (a) | (b) | ||||||
|---|---|---|---|---|---|---|---|
| Q x 10-6m3min-1 | τr (kgcats/m3) | Q x 10-6m3min-1 | τr (kgcats/m3) | ||||
| C2H6 | CO2 | Ar | C3H8 | CO2 | Ar | ||
| 70 | 280 | 1050 | 3.4 | 35 | 315 | 1050 | 3.4 |
| 60 | 240 | 900 | 4 | 30 | 270 | 900 | 4 |
| 50 | 200 | 750 | 4.8 | 25 | 225 | 750 | 4.8 |
| 40 | 160 | 600 | 6 | 20 | 180 | 600 | 6 |
Table 1: Flow rate in the fixed bed reactor (Q). Operating conditions: 1023 K, 1073 K, 1.0 bar, 8 × 10⁻² g catalyst. (a) ethane-CO2, (b) propane-CO2.
A thermal sensor and external heating provided the reactor with a controlled temperature of 1023 or 1073 K with an accuracy of ± 1 K. The gas samples of the reaction products were collected on-line from the effluent flow of the reactor. The residual reactants and the products were analyzed by a gas chromatograph (Saturn 2000, Varian), equipped with a Carbosphere 20/80 (Alltech) column and a thermal conductivity detector.
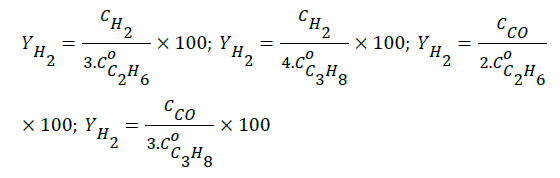
The conversions for ethane and propane were calculated by Xm=102(Cm0–Cm)/Cm0 where Cm is the molar concentration of the species (m=C2H6, C3H8). The yields of hydrogen and carbon monoxide, based on the stoichiometry of the overall reactions (C2H6+CO2 → 2CO+(3/2)H2 ; C3H8+CO2 → 2CO+(4/3)H2), were calculated as follows:
Results and Discussion
Catalyst characterization
The nickel content and the surface area of the catalyst, characterized by AAS and B.E.T.-N2, were 3.92% by weight and 1.56 × 10² m2/g, respectively. The thermal analyses (TG, DTG, Figure 1) revealed mass losses of water (13.0%) and NO2 (10.0%) from the impregnated precursor (Ni(NO3)2.6H2O). The TG plot exhibited the initial calcination temperature of the precursor. The curve of differential thermal analysis (DTA) shows two endothermic peaks, which represent the processes of vaporization of water and nitrate decomposition. The maximum temperatures for water loss and nitrate decomposition were 427.9 K and 814.5 K, respectively. Losses progressed to 1273 K possibly due to NOx emissions.

Figure 1: Thermal analyses of materials obtained during de preparation of the Ni(3.92%wt.)/γ-Al2O3 catalyst.
As the catalyst was being prepared, from the step of support in natura (steps-1, 2) up to the reduction, in the infrared spectra (FTIR, 2) the presences of crystalline water (3600-3100 cm-1), hydrogen bonds (3600-3200 cm-1, 1630-1600 cm-1), and NO2 and nitrate (1632, 1383, 827 cm-1) were identified. Nitrates appear in the impregnation phase (step-3), decreasing after calcination (step-4) and practically no longer exists when the catalyst was reduced (step-5), while NO2 groups and hydrogen bonds remain (Figure 2).

Figure 2: FTIR analyses of materials obtained during the preparation of the Ni(3.92%wt.)/γ-Al2O3 catalyst. (a) support (step-1) (b) pre-treated support (step-2) (c) support impregnated with precursor (step-3) (d) catalyst after calcination (step-4) (e) catalyst after reduction (step-5).
The catalyst was characterized by XRD prior and after the reaction operations. Figure 3 shows the diffracto grams of the phases present in each catalyst preparation step.

Figure 3: XRD analyses of materials obtained during the preparation of the Ni(3.92%wt.)/γ-Al2O3 catalyst. (a) support in natura (step-1) (b) pre-treated support (step-2) (c) support impregnated with precursor (step-3) (d) catalyst after calcination (step-4) (e) catalyst after reduction (step-5).
The solid phases were identified as the support γ-Al2O3 (2θ 37.4, 45.3, 65.8, 66.6), the nickel metallic phase (2θ 44.1, 52.0, 77.5, 93.4) and traces of NiO (2θ 36.2, 43.3) in the fresh catalyst, and its forms Ni3C (nickel carbide, 2θ 46.2) and NiAl2O4 (nickel aluminate, 2θ 44.8, 66.7) in the catalyst after reaction.
Process evaluation
The alkane-CO2 mixtures were processed with the Ni(3.92%wt)/γ- Al2O3 catalyst in a continuous fixed bed reactor providing effluents composed of ethane or propane residuals and carbon dioxide, and the products carbon monoxide, hydrogen, water, methane, ethylene, propylene and carbon deposits (coke). The concentration evolutions of the reactants obtained in the operations with four different flow rates are presented (Figure 4) as a function of time. The experimental steady-state values of the concentrations were evaluated as the component concentration left unchanged over the time (90-110 min).

Figure 4: Concentration evolutions of the reactants in the dry reforming processes. Effect of feeding flow rate. (a) ethane, (b) propane. Conditions: cat. Ni(3.92%wt.)/γ-Al2O3, 1073 K, 1.0 bar, ethane feed: C2H6:CO2:Ar=5:20:7 vv; propane feed: C3H8:CO2:Ar=2.5:22.5:75 vv.
The experimental steady-state values of the concentrations measured in the effluent flow of the reactor enabled quantification of hydrocarbon conversions in both alkane-CO2 processing. The highest conversions of the alkanes were obtained when a longer spacetime (6.0 kgcats/m3) was employed.
The concentration evolutions of the hydrogen obtained from the processing of ethane and propane, are shown in Figure 5, while the concentration evolutions of the produced methane are presented in Figure 6.

Figure 5: Concentration evolutions of hydrogen in the dry reforming processes. Effect of feeding flow rate. (a) H2(ethane), (b) H2(propane). Conditions: cat. Ni(3.92%wt.)/γ-Al2O3, 1073 K, 1.0 bar, ethane feed: C2H6:CO2:Ar=5:20:7 vv; propane feed: C3H8:CO2:Ar=2.5:22.5:75 vv.

Figure 6: Concentration evolutions of methane in the dry reforming processes. Effect of feeding flow rate. (a) CH4 (ethane), (b) CH4 (propane). Conditions: cat. Ni(3.92%wt.)/γ-Al2O3, 1073 K, 1.0 bar, ethane feed: C2H6:CO2:Ar=5:20:75 vv; propane feed: C3H8:CO2:Ar=2.5:22.5:75 vv.
Conversions of ethane and propane reached steady-state levels of 32% and 50% at 1023 K, respectively, with higher hydrogen yields (up to 24%) from propane. However, with the 50-degree rise in operating temperature, higher conversions of both alkanes were observed (ethane 74.7%, propane 96.0%), with consequent increase of yields, reaching approximately 35% and 44%, from ethane and propane, respectively.
Modeling and kinetic evaluation
Based on the experimental evidence (Figures 4-6) for both reforming processes, according to analyses taken on line in the effluent gas of the reactor, a set of reaction steps were proposed where the major reaction steps (Table 2) were adopted for kinetic evaluation.
| Ethane-CO2 reforming (E) | Propane-CO2 reforming (P) | Reaction steps |
|---|---|---|
 |
 |
Cracking of alkanes |
 |
 |
Boudouard reverse reaction |
 |
 |
CO-CO2, H2 interactions |
 |
 |
Decomposition of products (Hc, CH4) |
*C2H4 + CH4 = Hc, identified as hydrocarbon (Hc).
Table 2: Reaction steps of the alkane-CO2 reforming processes.
According to the stoichiometry of the reaction steps, the rates of hydrogen and carbon production in each reform process can be formulated. The relations rjm (j=I, II, III, IV; m=ethane, propane) correspond to the rate laws of the reaction steps of the reforming processes and are expressed as follows:
- Decomposition of ethane and propane (Langmuir-Hinshelwood approach),
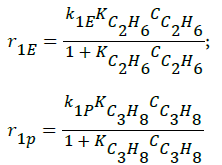 (1)
(1)
- Reverse Boudouard reactions;
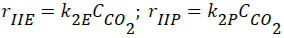 (2)
(2)
- Interactions of carbon oxides and hydrogen (Langmuir- Hinshelwood approach), considering weak adsorption of the all intermediate components (CO, CO2, H2, H2O),
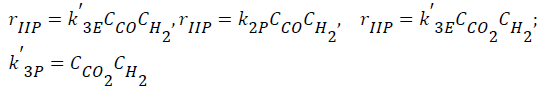 (3)
(3)
Consumptions of the products (ethylene, methane; CC2H4+CCH4=CHc) (Langmuir-Hinshelwood approach),
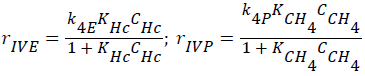 (4)
(4)
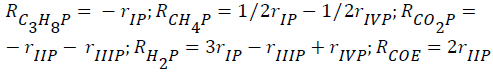
The global reaction rates of each component (Rim; i=C2H6, C3H8, CH4, Hc, CO2, CO, H2, H2O; m=ethane, propane) were written as follows:
for ethane-CO2 reforming:
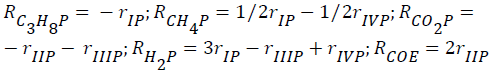
- for propane-CO2 reforming:
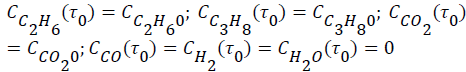
The evolutions of the reactor effluent concentrations were obtained from mass balances including reaction rates of the reaction steps. The resulting differential equations were expressed as–dCim/dτ+Rim=0, where τ (τ=mcat/Q, kgs/m3) is the space time. The corresponding initial conditions (τ=τ0) were expressed as follows:
To solve the system of differential equations the numerical method of Runge-Kutta 4th order was employed. A numerical optimization procedure was associated with the solution method where the parameter values were modified by comparing for each component (i) the calculated concentrations.  with the experimental
 ones. The optimized final values of the parameters were obtained by defining a quadratic objective function
 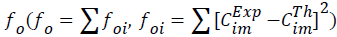 applied to the results obtained for all components.
Figure 7 shows calculated versus experimental effluent concentration values for the products (H2, CO, Hc, from ethane; H2, CO, CH4, from propane) obtained at the two operating temperature conditions (1023 K, 1073 K). The order of magnitude of the objective functions were fO=4.17 × 10⁻², and fO=9.46 × 10⁻², for the results of the evaluations carried out with ethane and propane, respectively. Figures 8 and 9 shows calculated versus experimental effluent concentration values for the products (H2, CO, Alk; H2, CO, CH4) obtained at the two operating temperature conditions (1023 K, 1073 K).

Figure 7: Reforming process ethane-CO2 and propane-CO2. Predicted and experimental effluent concentration of products. Conditions: Catalyst Ni(3.92%wt.)/γ-Al2O3, 1.0 bar.

Figure 8: Calculated and experimental effluent concentration values for the products.

Figure 9: Calculated and experimental effluent concentration values for the products.
The final values of the kinetic parameters are listed in Tables 3 and 4. The specific reaction rates for the cracking stages (I, IV) at 1073 K were of particular note in the kinetic behavior of both processes. Hydrogen production occurred through the steps I and IV with k1E=2.29 × 10⁻² mol/gcats, k4E=1.11 × 10⁻³ mol/gcats for ethane dry reforming, and k1P=2.40 × 10⁻³ mol/gcats k4P=0.85 × 10⁻² mol/gcats, for propane dry reforming. By these steps, carbon productions with significant reaction rates are also indicated.
| Parameter | 1023 K | 1073 K |
|---|---|---|
| k1E (mol/gcats) | (7.30 ± 0.11) x 10-4 | (2.29 ± 0.03) x 10-2 |
| k2E (m3/gcats) | (2.50 ± 0.08) x 10-5 | (3.06 ± 0.09) x 10-5 |
| k'3E ((m3)2/gcatsmol) | (1.24 ± 0.04) x 10-6 | (2.81 ± 0.08) x 10-5 |
| k4E (mol/gcats) | (1.69 ± 0.03) x 10-4 | (1.11 ± 0.02) x 10-3 |
Table 3: Kinetic parameters of ethane-CO2 reforming process. Effect of temperature.
| Parameter | 1023 K | 1073 K |
|---|---|---|
| k1P (mol/gcats) | (6.39 ± 0.10) x 10-4 | (0.85 ± 0.04) x 10-2 |
| k2P (m3/gcats) | (2.31 ± 0.07) x 10-5 | (3.89 ± 0.12) x 10-5 |
| k'3P ((m3)2/gcatsmol) | (9.17 ± 0.30) x 10-5 | (1.03 ± 0.03) x 10-4 |
| k4P (mol/gcats) | (8.06 ± 0.12) x 10-3 | (2.40 ± 0.13) x 10-3 |
Table 4: Kinetic parameters of propane-CO2 reforming process. Effect of temperature. Conditions: Catalyst Ni(3.92%wt.)/γ-Al2O3, 1.0 bar.
Considering the set of four steps for each of the alkanes as competitive reaction steps, kinetic selectivities (Sim=[kim/Σkim] × 102, i=1, 2, 3, 4; m=E-ethane, P-propane) were calculated to highlight the fastest reaction steps related to the hydrogen production. For ethane dry reforming S1E=95.42% and S4E=4.58%, while for propane dry reforming S1P=21.74% and S4P=76.99%. Thus, during the operation of dry reforming of natural gas, in addition to the hydrogen obtained from methane, the alkane contributions to hydrogen production can occur mainly by the cracking of ethane (step I, ethane) and cracking of the produced methane from propane (step IV, propane).
The orders of magnitude of the adsorption constants of the reactants and intermediate hydrocarbons (methane, ethylene) were also estimated by the model adjustments, being in the range of order of magnitude of 0.012 to 1.11 m3/mol. These values are considered indicators of relatively strong adsorption of these components, aspects that favor their activation on the surface of the catalyst and consequent decomposition to hydrogen.
Given the presence of alkanes (ethane, propane) in the natural gas feed, attention was paid to their contributions in the product composition according to their conversion through dry reform. Thus, two main aspects are highlighted: the additional production of hydrogen from the alkanes and the increase of coke formation, due to the production of carbon.
An evaluation based on the mechanisms indicated in Table 1 was made from the following global chemical equations:
- for the dry reforming of ethane, C2H6+CO2 → 2H2+2C+H2O+CO;
- for the dry reforming of propane, C3H8+2CO2 → 2H2+3C+2H2O +2CO
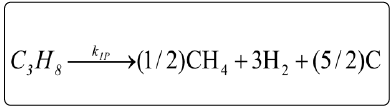
The predominant presence of methane in the natural gas indicated the need to include data concerning the dry reform of this component (CH4+CO2 → H2+3CO + H2O), as collected in a previous work.
Assuming the processing of a natural gas (NG, Brazilian natural gas, Guamaré, ANP, Brazil) of composition CNG: CH4 (85.45% vv), C2H6 (8.26% vv), C3H8 (3.06% vv), and considering the conversions reached in the present work, the yields (YH2, YC) were obtained based on natural gas feed composition, as follows:
-for hydrogen,
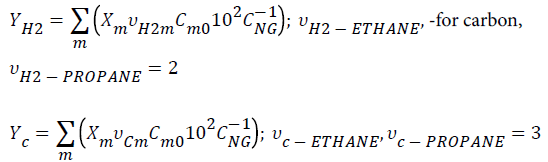
Where Cm0 and Xm are alkane initial concentration and conversion, respectively. Table 5 lists the values of hydrogen and carbon yields.
| Reforming process | Xm (% ) | YH2 (%) | YC (%) |
|---|---|---|---|
| Methane-CO2* | 84.23 | 74.17 | ---- |
| Ethane-CO2 | 74.71 | 12.75 | 12.75 |
| Propane-CO2 | 96 | 7,14 | 10.71 |
| NG | 81.07 | 95.06 | 23.46 |
* Abreu et al.
Table 5: Evaluation of natural gas dry reforming processes. Hydrogen and carbon molar yields. Conditions: Cat. Ni (3.92% weight)/γ-Al2O3; 1073 K, 1.0 bar; τ=6.0 kg/m3.
Natural gas rich in methane increased the production of hydrogen via dry reforming due to the contributions of the other alkanes present in the feed composition. Operating in a fixed bed reactor, additional hydrogen production was obtained in relation to that obtained from methane, whose yield was 74.61%. From the conversions of the major components of natural gas (methane, ethane, propane) it was obtained about 95% of molar hydrogen yield, where 19% were from alkanes different from methane. From these alkanes, the carbon formation was quantified as a molar yield of 23%.
In view of these results and considering the significant increased hydrogen production due to the light alkane conversions by dry reforming, an adequate supply of carbon dioxide is recommended to prolong the catalyst activity and, consequently, to allow a longer campaign time for the processing unit. In this case, carbon dioxide fed in excess, and acting mainly through the Reverse Boudouard reaction, may have reduced catalyst deactivation due to coke deposition.
Conclusions
The reforming of light alkanes of natural gas with carbon dioxide was carried out at 1073 K under atmospheric pressure employing a nickel catalyst (3.92%wt) supported on gamma alumina. Taking into account the individual conversions of the main components of natural gas (84.23%, methane; 74.71%, ethane; 96.00%, propane), a hydrogen molar yield of 95.06% was obtained, where the contribution of 20% was due to the light alkanes, ethane, and propane. From these alkanes, the carbon formation reported as occurring through the cracking reactions of the dry reform, was quantified, reaching a molar yield of 23%.
Reaction steps in the reforming process were considered as competitive reactions and the specific cracking reaction rates of both light alkanes were used to quantify the kinetic selectivities of hydrogen, calculated as 95.42% for ethane and 76.99% for propane.
Acknowledgements
The authors acknowledge financial support from MCT/ANP (PRH-28) and PETROBRAS, Brazil. The English text of this paper has been revised by Sidney Pratt, Canadian, MAT (The Johns Hopkins University), RSAdip-TESL (Cambridge University).
REFERENCES
- Ma Z, Trevisanut C, Neagoe C, Boffito DC, Jazayeri SM. A microrefinery to reduce associated natural gas flaring. Sustainable Cities and Society. 2016;27:116-121.
- Petersen AK, Bak Hansen JH, Christensen TS, Dybkjaer I, Christensen PS. Technologies for large-scale gas conversion. Applied Catalysis A: General. 2001;221:379-387.
- Yagi F, Kanai R, Wakamatsu S, Kajiyama R, Suehiro Y. Development of synthesis gas production catalyst and process. Catalysis Today. 2005;104: 2-6.
- Wolf JJ, Perkavec MA. Safety Aspects and Environmental Considerations for a 10 MW Cogeneration Heavy Duty Gas Turbine Burning Coke Oven Gas With 60% Hydrogen Content. The American Society of Mechanical Engineers. 1992;pp:1-8.
- Yin H, Ding Y, Luo H, Yan L, Wang T. The Performance of C2 Oxygenates Synthesis from Syngas over Rh−Mn−Li−Fe/ SiO2 Catalysts with Various Rh Loadings. Energy Fuels. 2003;17:1401-1406.
- Verykios XE. Carbon dioxide reforming of methane to synthesis gas was studied over Ni-based catalysts. Journal of Hydrogen Energy. 2002;28:1045-1046.
- Verykios XE. Catalytic dry reforming of natural gas for the production of chemicals and hydrogen. Hemijska Industrija. 2002;56:238-255.
- Ojeda M, Granados ML, Rojas S, Terreros P, Garcıá -Garcıá FJ. Manganese-promoted Rh/Al2O3 for C2-oxygenates synthesis from syngas: Effect of manganese loading. Applied Catalysis A: General. 2004;261:47-55.
- Saad JM, Williams PT. Manipulating the H2/CO ratio from dry reforming of simulated mixed waste plastics by the addition of steam. Fuel Processing Technology. 2017;156:331-338.
- Smead RG. Mexican energy reform-new production could eventually threaten US exports. Natural Gas & Electricity. 2017;34:27-29.
- Zainab IS, Adiya G, Dupont V, Mahmud T. Chemical equilibrium analysis of hydrogen production from shale gas using sorption enhanced chemical looping steam reforming. Fuel Processing Technology. 2017;159:128-144.
- Sousa-Aguiar EF, Noronha FB, Faro A Jr. The main catalytic challenges in GTL (gas-to-liquids) processes. Catalysis Science & Technology. 2011;1:698-713.
- Aljerf L. Fabrication and testing of a sulfonic acid catalyst suitable for the biofuel production reaction. Africa Science. 2015;p:1.
- Kanitkar SR, Spivey JJ. Light alkane aromatization: efficient use of natural gas. Natural Gas Processing from Midstream to Downstream. 2018.
- Wu X, Wu R, Wu S. Kinetic study of reactive sorption-enhanced reforming of coke oven gas for hydrogen production. Journal of Natural Gas Science and Engineering. 2015;27:1432-1437.
- Xu J, Lin W, Xu S. Hydrogen and LNG production from coke oven gas with multi-stage helium expansion refrigeration. International Journal of Hydrogen Energy. 2018;43:12680-12687.
- Abreu CAM, Santos JAP, Lima Filho NM, Santos DA. Kinetic evaluation of methane-carbon dioxide reforming process based on the reaction steps. Industrial and Engineering Chemistry Research. 2008;47:4617-4622.
- Nandini A, Pant KK, Dhingra SC. Kinetic study of the catalytic carbon dioxide reforming of methane to synthesis gas over Ni-K/ CeO2-Al2O3 catalyst. Applied Catalysis A: General. 2006;308:119-127.
- Corthals S, Nederkassel JV, JanGeboers J, De Winne H, Noyen JV. Influence of composition of MgAl2O4 supported NiCeO2ZrO2 catalysts on coke formation and catalyst stability for dry reforming of methane. Catalysis Today. 2008;138:28-32.
- Laosiripojana N, Assabumrungrat S. Catalytic steam reforming of ethane over CeO2-doped Ni/Al2O3: Improvement of reactivity and resistance toward carbon formation by the doping of CeO2. Proceedings International Hydrogen Energy Congress and Exhibition IHEC. 2005;85:323-332.
- Koo KY, Roh HS, Seo YT, Seo DJ, Yoon WL. Coke study on MgOpromoted Ni/Al2O3 catalyst in combined H2O and CO2 reforming of methane for gas to liquid (GTL) process. Applied Catalysis A: General. 2008;340:183-190.
- Pan YX, Liu CJ, Shi P. Preparation and characterization of coke resistant Ni/SiO2 catalyst for carbon dioxide reforming of methane. Journal of Power Sources. 2008;176:46-53.
- Horváth A, Stefler G, Geszti O, Kiennema A. Methane dry reforming with CO2 on CeZr-oxide supported Ni, NiRh and NiCo catalysts prepared by sol–gel technique: Relationship between activity and coke formation. Catalysis Today. 2011;169:102-111.
- Laosiripojana N, Sangtongkitcharoen W, Assabumrungrat S. Catalytic steam reforming of ethane and propane over CeO2- doped Ni/Al2O3 at SOFC temperature: Improvement of resistance toward carbon formation by the redox property of doping CeO2. Fuel. 2006;85:323-332.
- Jesper JHB, Sattler JRM, Santillan-Jimenez E, Weckhuysen BM. Catalytic Dehydrogenation of Light Alkanes on Metals and Metal Oxides Chem Rev. 2014;114:10613-10653.
- Alipour Z, Rezaei M, Meshkani F. Effect of alkaline earth promoters (MgO, CaO, and BaO) on the activity and coke formation of Ni catalysts supported on nanocrystalline Al2O3 in dry reforming of methane. Journal of Industrial and Engineering Chemistry. 2014;20:2858-2863.
- Faramawy S, Zaki T, Sakr AAE. Natural gas origin, composition, and processing: A review. Journal of Natural Gas Science and Engineering. 2016;34: 34-54.
- Sutton D, Moisan JF, Ross JRH. Kinetic study of CO2 reforming of propane over Ru/Al2O3. Catalysis Letters. 2001;75:175-181.
- Solymosi F, Tolmacsov P, Kedves K. CO2 refoming of propane over supported Rh. Journal of Catalysis. 2003;216:377-385.
- Solymosi F, Tolmacsov P, Zakar TS. Dry reforming of propane over supported Re catalyst. Journal of Catalysis. 2005;133:51-59.
Citation: de Vasconcelos SM, de Souza AEA, Araújo MS, Silva MAM, Araújo FAD, de Lima Filho NM, et al. (2019) Nitrogen Starvation of Assessment in the Production of Single Cell Oils and Biodiesel Quality in Heterotrophic Cultures of Cyanobacteria Phormidium autumnale. J Adv Chem Eng 9:191. doi: 10.35841/2090-4568.9.191
Copyright: © 2019 de Vasconcelos SM, et al. This is an open-access article distributed under the terms of the Creative Commons Attribution License, which permits unrestricted use, distribution, and reproduction in any medium, provided the original author and source are credited.