PMC/PubMed Indexed Articles


Indexed In
- Online Access to Research in the Environment (OARE)
- Open J Gate
- Genamics JournalSeek
- JournalTOCs
- Scimago
- Ulrich's Periodicals Directory
- Access to Global Online Research in Agriculture (AGORA)
- Electronic Journals Library
- Centre for Agriculture and Biosciences International (CABI)
- RefSeek
- Directory of Research Journal Indexing (DRJI)
- Hamdard University
- EBSCO A-Z
- OCLC- WorldCat
- Scholarsteer
- SWB online catalog
- Virtual Library of Biology (vifabio)
- Publons
- MIAR
- University Grants Commission
- Euro Pub
- Google Scholar
Useful Links
Share This Page
Journal Flyer
Open Access Journals
- Agri and Aquaculture
- Biochemistry
- Bioinformatics & Systems Biology
- Business & Management
- Chemistry
- Clinical Sciences
- Engineering
- Food & Nutrition
- General Science
- Genetics & Molecular Biology
- Immunology & Microbiology
- Medical Sciences
- Neuroscience & Psychology
- Nursing & Health Care
- Pharmaceutical Sciences
Research Article - (2019) Volume 10, Issue 12
Effect of Fiber Content in Practical Diet on Feed Utilization and Antioxidant Capacity of Loach, Misgurnus anguillicaudatus
Ying Sun, Xing Zhao, Haiyan Liu and Zhencai Yang*Received: 21-Nov-2019 Published: 31-Dec-2019
Abstract
This study aimed to evaluate the effect of fiber content on feeding, growth performance, feed utilization and antioxidant ability of Taiwanese loach. The experimental feeds were divided into six groups, with crude fiber contents of 4.70%, 4.92%, 5.15%, 5.44%, 5.79% and 6.06%, respectively. A total of 576 loaches were randomly divided into 6 groups with 8 replicates of twelve fish each, and fed for 60 days. The results showed that crude fiber levels had significant effects on feeding rate (FR), feed conversion rate (FCR) and protein efficiency ratio (PER) in loaches, while specific growth rate (SGR) showed no significant difference (P>0.05). Crude fiber content had a significant effect on loach digestibility (P<0.05), first showing an increasing trend before dropping. There was no significant change in tryptase and lipase activities (P>0.05), while amylase activity decreased significantly (P<0.05). With increasing crude fiber content, MDA content in loach liver decreased significantly (P<0.05), while SOD activity did not change significantly. According to the current comprehensive evaluation, the appropriate crude fiber content in Taiwanese loach feed was 5.52% - 5.65%.
Keywords
Taiwanese loach; Fiber; Feed conversion rate; Digestibility; Antioxidant capacity
Introduction
The pond loach (Misgurnus anguillicaudatus) belongs to Cobitidae of the order Cypriniformes, and is popular among Chinese due to its rich nutrients and pleasant taste, with the market demand increasing year by year. The development of intensive aquaculture represents an effective tool to meet human needs, and compound feed is the basis of intensive aquaculture. However, there are few studies assessing the nutritional needs of the loach, and data are insufficient to support the development of special compound feed for this species. Moreover, the high cost of feed in aquaculture makes it unaffordable for some fish farmers. Therefore, assessing loach’s compound feed with balanced nutrition and high cost performance is of high importance.
With the gradual increase of plant components in fish feed formulations, higher fiber amounts will inevitably be added to the feed. The main component of plant fiber is cellulose, a macromolecule polysaccharide composed of glucose, insoluble in water and general organic solvents, and the main plant cell wall component. Cellulose is the most widely distributed and abundant polysaccharide in nature, accounting for more than 50% of the carbon content in the plant kingdom [1]. According to current research, cellulose plays a vital role in improving feed stickiness, stimulating digestive tract peristalsis, and promoting food movement, digestion and absorption.
Previously, the cellulose needs were mainly met by adding pure cellulose [2], and crude fiber containing feeds were less investigated. However, in actual production, crude fiber is usually employed to assess the nutritional composition of compound feeds, rather than cellulose. Adamidou et al. [3] found that fiber content of up to 5% does not affect the growth performance or nutrient digestibility of the Sharpsnout Seabream. Bou et al. [4] also demonstrated that adding up to 18% fiber in the feed does not affect the growth performance of the gilthead sea bream. Bonvini et al. showed that the insoluble fiber at no more than 15.5% in feed formulation is feasible for the growth and development of the European sea bass without affecting animal growth performance and health. Altan and Korkut et al. [5] also pointed out that low dietary fiber concentration (3%-5%) may be beneficial to fish growth, while too high fiber level may reduce the apparent digestibility of dry matter and the efficiency ratio of other nutrients.
Currently, crude fiber content has been mainly assessed in the feed of carnivorous fish, and no research has evaluated the fiber demand in omnivores feed, and the suitable crude fiber content varies greatly among species. In this study, the Taiwanese loach was used as an experimental object to assess different fiber content feeds, exploring the effect of fiber on immune parameters, feeding and growth performance. We aimed to determine the optimal fiber content in Taiwanese loach feed and provide a theoretical basis for improving feed utilization and reducing feed cost of loach.
Materials and Methods
Experimental design
Based on the practical prescription, wheat bran was modulated in order to achieve different fiber levels. Six isonitrogenous and isoenergetic experimental feeds with crude fiber contents of 4.70% (Group A), 4.92% (Group B), 5.15% (Group C), 5.44% (Group D), 5.79% (Group E) and 6.06% (Group F) were prepared. A total of 574 Taiwanese loaches with an initial average weight of 15.81 ± 0.83 g were divided into the six groups with eight replicates each of 12 individuals. Fish feeding and growth during the study and antioxidant capacity at the end of the experiment were measured.
Experimental materials
The Taiwanese loach was supplied by the Loach farm of Hengshui (Hebei, China). Six pellet feeds with isonitrogenous and isoenergetic particle size of 0.6mm were formulated by adding 3.5%, 7.0%, 10.5%, 14.0%, 17.5% and 21.0% wheat bran to fishmeal, soybean meal, peanut meal, beer yeast, rapeseed meal and cottonseed meal as protein feedstuffs, using wheat flour and soybean meal to balance nutrients. In order to determine the digestibility of nutrients, 0.1% Y2O3 was added to the feed as an endogenous indicator. Feed formulation and nutrient compositions of the experimental feeds are presented in Table 1.
| Diet | ||||||
|---|---|---|---|---|---|---|
| Ingredients (g/kg) | A | B | C | D | E | F |
| Fish meal | 200 | 200 | 200 | 200 | 200 | 200 |
| Wheat bran | 35 | 70 | 105 | 140 | 175 | 210 |
| Wheat flour | 255 | 223 | 191 | 159 | 127 | 95 |
| Soybean meal | 125 | 122 | 119 | 116 | 113 | 110 |
| Beer yeast | 28 | 28 | 28 | 28 | 28 | 28 |
| Cottonseed meal | 68 | 68 | 68 | 68 | 68 | 68 |
| Rapeseed meal | 55 | 55 | 55 | 55 | 55 | 55 |
| Soybean oil | 21 | 21 | 21 | 21 | 21 | 21 |
| Soybean lecithin | 35 | 35 | 35 | 35 | 35 | 35 |
| Ca (H2PO4)2 | 36 | 36 | 36 | 36 | 36 | 36 |
| CaCO3 | 10 | 10 | 10 | 10 | 10 | 10 |
| NaCl | 10 | 10 | 10 | 10 | 10 | 10 |
| Othersa | 13 | 13 | 13 | 13 | 13 | 13 |
| Y2O3 | 1 | 1 | 1 | 1 | 1 | 1 |
| Premixb | 18 | 18 | 18 | 18 | 18 | 18 |
| In total | 1000 | 1000 | 1000 | 1000 | 1000 | 1000 |
| Proximate analyses (%) | ||||||
| Crude fiber | 4.70 | 4.92 | 5.15 | 5.44 | 5.79 | 6.06 |
| Moisture | 8.14 | 8.25 | 8.71 | 8.85 | 8.67 | 8.02 |
| Crude protein | 32.55 | 32.51 | 32.04 | 32.52 | 32.33 | 32.63 |
| Crude lipid | 5.63 | 5.61 | 5.76 | 5.67 | 5.77 | 5.81 |
| Crude ash | 12.88 | 12.95 | 13.03 | 13.23 | 13.33 | 13.45 |
| Gross energy (KJ/g) | 16.22 | 16.35 | 16.26 | 16.27 | 16.35 | 16.59 |
bPremix: Vitamin A, 1000 IU/g; Vitamin D3, 500 IU/g; Vitamin K3, 0.6 mg/g; Vitamin E, 5.5 mg/g; Vitamin B1, 0.6 mg/g; Vitamin B2, 1.2 mg/g; Vitamin B3, 3.0 mg/g; Vitamin B5, 5.0 mg/g; Vitamin B6, 1.1 mg/g; Vitamin B11, 0.1 mg/g; Vitamin B12, 0.001 mg/g; Biotin, 0.002 mg/g; Inositol, 15.0 mg/g; Vitamin C, 20.0 mg/g; CuSO4�5H2O, 0.5 mg/g; ZnSO4�H2O, 5.0 mg/g; FeSO4�7H2O, 8.0 mg/g; MnSO4�H2O, 3.0 mg/g; Na2SeO3�5H20, 20 �mg/g; CoCl�6H2O, 50 �g/g; KI, 40 �g/g. The ingredients used to formulate the above diets were obtained from Hebei Haitai Technology Corporation, Shijiazhuang, China.
Table 1: Ingredient compositions of experiment diets.
Experimental conditions
Fish were bred at the Aquaculture Research Center, Hebei Normal University, Hebei province, China. Loaches with uniform size were randomly allocated to six groups of 48 aquaculture tanks with diameter of 50 cm, height of 50 cm and water depth of 35 cm. Each tank had 12 loaches. During the experimental period, the environment met the following conditions. The water temperature was 27 ± 0.1°C, and water quality was maintained by using a reverse gas lift filter and partial water exchange. The pH was around 7.5. Artificial illumination was used for illumination, at 120 lux with a photoperiod of 11 hr light (7:30-18:30) and 13 hr dark. The environment was kept quiet throughout the experiment.
Experimental process
Prior to the start of the trial, juvenile Taiwanese loaches were fed commercial feed thrice daily to acclimatize to the experimental environments for 2 weeks and the fish were weighed at the end of the acclimatization period. All fish were fasted of feed for 24 hr and weighed before starting the feeding experiment. Fish were fed thrice a day at 8:00, 12:30 and 17:00 to satiation. After 30 minutes of feeding, the residual diet was sucked out by siphon, collected in a bag, placed in the electric thermostatic drying oven, dried at a constant temperature of 65°C, and weighed, recording the dry weight of the residual diet; the dissolution rate of the feed was measured to correct the actual feed intake. At the end of the trial, all fish in each aquarium were weighed after 24 hr of fasting.
Analysis and Measurements
Sample collection
Five fish randomly taken out from each tank were narcotized by MS222 (100 mg/L) (Beijing Green Hengxing Bio-technology Co., LTD, Beijing, China) and individually weighed. The liver and intestines were removed after anesthesia, respectively. The samples were flash frozen in liquid nitrogen and stored at −80°C. Four livers were randomly selected from each Group for the determination of SOD activity and MDA content, and four intestines were randomly selected from each Group for the determination of trypsin (U/ mgprot), lipase (U/gprot), amylase (U/mgprot). Fecal samples were collected from the 7th day to the end of the experiment. The dry fecal samples were stored at -20°C until use for apparent digestibility analysis.
Biochemical analysis
The nutrient compositions of the diets were analyzed following the procedures of the Association of Official Analytical Chemists (AOAC, 2000) [6]. The samples were dried to constant weight at 105°C in an electric thermostatic drying oven (GZX-9240MBE, Shanghai, China). Crude protein content was measured by the Kjeldahl method, on an Auto Kjeldahl System (Kjeltec 8400, FOSS, Denmark). Crude lipid content was measured after ether extraction in a Soxhlet extractor. Ash amounts were measured by placing the sample at 550°C in a muffle furnace (SX-5-10, Tianjin, China). Gross energy was measured on an adiabatic bomb calorimeter (Parr 6300, USA). Yttrium content was measured by inductively coupled plasma mass spectrometry. Crude fiber content was determined according to the intermediate filtration method (ISO, 6865:2000) [7]. The proximate compositions of the diets are listed in Table 1.
Before analysis, the liver and intestines were adequately pulverized in ice cold 0.86% NaCl solution. The resulting mixture was centrifuged at 2,000 g for 15 min to extract the supernatant. Liver superoxide dismutase (SOD) and lipid peroxidation (MDA) activities were determined using specific commercial kits (Nanjing Jiancheng Bioengineering Institute). The degree of cytochrome c reduction by the superoxide radicals generated in the xanthinexanthine oxidase system was determined at 550 nm to measure SOD activity [8]. MDA level was measured based on the reaction of MDA and 2-thiobarbituric acid in which a product with an absorption peak at 532 nm could be determined [9]. Trypsin specific activity was assayed by using a trypsin kit (Nanjing Jiancheng Bioengineering Institute, No. A080-2); trypsin in 1 mg protein, which results in absorbance change of 0.003 in 1 min at 37°C and pH 8.0, was considered an activity unit. Lipase specific activity was assayed by using a lipase kit (Nanjing Jiancheng Bioengineering Institute, No. A054-1). Lipase in 1g protein, which hydrolyzes 1μmol substrate (triglyceride) at 37°C, was considered an activity unit. Amylase specific activity was assayed by using an amylase kit (Nanjing Jiancheng Bioengineering Institute, No. C016-1). Amylase in 1 mg protein, which hydrolyzes 10 mg substrate (starch) in 30 min at 37°C, was considered an activity unit.
Data processing and statistical analysis
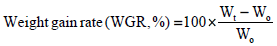
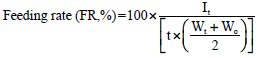
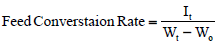
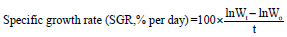
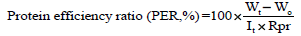
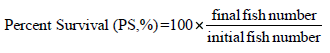
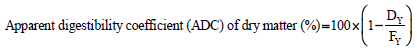
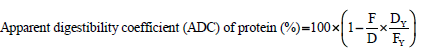
Where W0(g) and Wt(g) is the initial and final body weight, respectively, t(d) is the experiment period (d), It(g) is the accumulated feed intake, Rpr is the feed protein content. D and F represent protein contents in diet and faeces, respectively. DY and FY represent Y2O3 contents in diet and faeces, respectively.
Statistical analysis was performed with Statistica 6.0. Fiber content was estimated by polynomial regression analysis based on FR, FCR, PER, ADCd and ADCp of the Taiwanese loach. All data were assessed by one-way analysis of variance (ANOVA) with repeated measurements. When a test indicated statistical significance, further analysis was conducted with Tukey’s test (P<0.05).
Results
Growth performance and feed utilization
The results in Table 2 showed that crude fiber content had a significant effect on the FR (F(5,42)=6.927, P=0.0001), but not on PS (F(5,42)=1.054, P=0.3960), FBW (F(5,42)=2.197, P=0.0725), SGR (F(5,42)=2.083, P=0.0866) and WGR (F(5,42)=2.037, P=0.0930) of the loach. Specifically, the FR in Group E was the lowest, followed by Group D, which showed significantly lower values than groups A, B and F. Different crude fiber contents had significant effects on the FCR in the Taiwanese loach (F(5,42)=5.062, P=0.0010). The FCR in Group E was the lowest, which was significantly lower than those of groups A, B and F. Fiber contents had significant effects on PER (F(5,42)=5.118, P=0.0009), with Group E showing the highest protein utilization rate, which was significantly higher than that of groups A, B and F.
Polynomial regression analysis showed that the regression relationship between FR and crude fiber content (F) was significant (F(5,42)=12.04, P=0.0000). As shown in Figure 1, the regression equation was FR=2.894F3-45.34F2+235.1F-398.0. According to the regression equation, the FR was the lowest at 5.65% crude fiber content. The FCR had a significant regression relationship with crude fiber content (F) (F(5,42)=8.816, P=0.0001), as shown in Figure 2. The regression equation was FCR=1.531F3-24.03F2+125.0 F-213.0; the lowest FCR was at 5.63% crude fiber content. There was a significant regression relationship between the PER and crude fiber content (F) (F(5,42)=8.856, P=0.0001), as shown in Figure 3. The regression equation was PER=-79.07F3+1239F2-6434F+ 11192. The PER of the loach was the highest at 5.64% crude fiber content.

Figure 1: Regression relationship between feeding rate (FR) and crude fiber content (F).

Figure 2: Regression relationship between feed conversion rate (FCR) and crude fiber content (F).

Figure 3: Regression relationship between protein efficiency ratio (PER) and crude fiber content (F).
The ADCs of dry matter and protein are shown in Table 2. The feed ADCd and ADCp were significantly affected by crude fiber content (F(5,12)=81.38, P=0.0000). F(5, 12)=67.73, P=0.0000). The ADCs of dry matter and protein of fish fed diet D were significantly higher than those of the other groups.
| Groups | A | B | C | D | E | F |
|---|---|---|---|---|---|---|
| PS (%) | 98.33 ± 3.33 | 99.17 ± 2.50 | 98.33 ± 3.33 | 98.33 ± 3.33 | 99.17 ± 2.50 | 95.83 ± 5.59 |
| IBW (g) | 1.33 ± 0.06 | 1.25 ± 0.04 | 1.31 ± 0.07 | 1.33 ± 0.06 | 1.32 ± 0.08 | 1.37 ± 0.03 |
| FBW (g) | 9.38 ± 0.81 | 8.74 ± 0.99 | 9.28 ± 0.94 | 9.75 ± 1.12 | 10.05 ± 0.87 | 8.80 ± 0.72 |
| FR (%) | 6.14 ± 0.35a | 6.12 ± 0.43a | 5.86 ± 0.47ab | 5.39 ± 0.35b | 5.38 ± 0.29b | 6.10 ± 0.24a |
| WGR (%) | 606.7 ± 75.1 | 601.7 ± 81.5 | 607.7 ± 59.6 | 634.8 ± 96.3 | 665.0 ± 76.1 | 544.0 ± 48.8 |
| SGR (%) | 3.25 ± 0.17 | 3.24 ± 0.19 | 3.26 ± 0.14 | 3.31 ± 0.22 | 3.38 ± 0.16 | 3.10 ± 0.13 |
| FCR | 2.46 ± 0.20ab | 2.46 ± 0.25ab | 2.35 ± 0.24abc | 2.14 ± 0.21bc | 2.11 ± 0.16c | 2.51 ± 0.17a |
| PER (%) | 115.40 ± 9.45cd | 115.79 ± 12.07bcd | 122.67 ± 12.34abcd | 132.14 ± 13.06ab | 134.69 ± 10.47a | 112.53 ± 6.96d |
| ADCd (%) | 60.25 ± 0.25c | 64.26 ± 0.46b | 65.79 ± 0.09a | 67.02 ± 0.49a | 66.27 ± 0.19a | 64.45 ± 0.55b |
| ADCp (%) | 71.67 ± 0.15d | 74.50 ± 0.30c | 75.23 ± 0.31bc | 76.48 ± 0.38a | 75.80 ± 0.16ab | 74.73 ± 0.34c |
Table 2: Effects of different crude fiber contents on feeding growth performance and digestibility of the Taiwan loach.
Polynomial regression analysis revealed a significant regression relationship between ADCd and crude fiber content (C) (F(2,15)=151.3, P=0.0000), as shown in Figure 4. The regression equation was ADCd=-9.890F2+109.1F-233.9. According to the above regression equation, the maximum ADCd of the Taiwanese loach was at 5.52% crude fiber content. The ADCp had significant regression with crude fiber content (F) (F(2,15)=107.4, P=0.0000). As shown in Figure 5, the regression equation was ADCp=- 6.549F2+72.45F-123.9. According to this regression equation, the maximum ADCp was at 5.53% crude fiber content.

Figure 4: Regression relationship between apparent digestibility coefficient of dry matter (ADCd) and crude fiber content (F).

Figure 5: Regression relationship between apparent digestibility coefficient of protein (ADCp) and crude fiber content (F).
Antioxidant indexes and digestive enzymes
There were significant differences in MDA content in the liver among groups (F(5,18)=7.705, P=0.0005), as shown in Table 3. The lowest liver MDA level was found in Group F. No significant differences were observed in hepatic SOD activities among all groups (F(5,18)=2.045, P=0.1205).
Crude fiber content had a significant effect on amylase activity (F(5, 17)=4.984, P=0.0049); Group F had the lowest value, and the remaining groups had no significant differences. Crude fiber content had no significant effects on trypsin and lipase activities (F (5, 17)=0.8056, P=0.5596; F (5, 17)=0.7005, P=0.6295, respectively) (Table 3).
| Items | A | B | C | D | E | F |
|---|---|---|---|---|---|---|
| SOD (U/ml) | 112.98 ± 8.95 | 118.15 ± 3.05 | 111.50 ± 5.23 | 121.56 ± 7.36 | 127.62 ± 6.50 | 119.67 ± 9.59 |
| MDA (nmol/ml) | 13.22 ± 2.96ab | 14.32 ± 1.03a | 7.55 ± 1.86bc | 6.76 ± 1.79c | 5.51 ± 1.28c | 9.77 ± 3.07abc |
| Trypsin (U/mg prot) | 1445.94 ± 167.01 | 1556.42 ± 354.16 | 1437.85 ± 235.88 | 1594.13 ± 438.89 | 1466.30 ± 222.26 | 1178.33 ± 163.01 |
| Amylase (U/mg prot) | 0.92 ± 0.19a | 0.87 ± 0.06ab | 0.87 ± 0.17ab | 0.60 ± 0.15ab | 0.57 ± 0.09b | 0.55 ± 0.12b |
| Lipase (U/mg prot) | 19.13 ± 4.80 | 15.56 ± 1.24 | 16.76 ± 1.01 | 17.08 ± 2.27 | 19.09 ± 5.82 | 19.14 ± 2.61 |
Table 3: Effects of crude fiber content on antioxidant indexes and digestive enzymes in the Taiwan loach.
Discussion
It is generally believed that fibers are hardly digested and absorbed by fish, and even if digestion occurs, fiber amounts are extremely limited. However, a certain fiber amount should be maintained in the feed. In the process of culture, the growth rate of fish determines the economic benefits. Therefore, improving growth performance and reducing the feed conversion ratio has become the target of many scholars. Some studies have found that there are no significant differences in growth indicators such as FR, SGR and FCR between the European sea bass and Nile tilapia when increasing dietary fiber amounts are added to the diet [10,11]. Studies also demonstrated that fiber addition to the feed inhibits the growth of the rainbow trout but increases its intake [12]. Bromley et al. [13] found that the trout can compensate up to 30% of cellulose by increasing total food intake, thereby stabilizing nutrient intake and growth rate, but cannot compensate for 40-50% fiber. In this study, no effects on FBW and SGR were obtained, but the FR of the Taiwan loach decreased first and subsequently increased. Growth in groups D and E was the best, but the FRs were significantly lower than those of other groups, while growth in Group F was inhibited but the FR showed an upward trend. This suggests that an appropriate fiber content may improve digestive efficiency in the loach and yield enough nutrients and energy. However, too high insoluble fiber content leads to food acceleration through the digestive tract and shortened digestion time [14], thus affecting the absorption of nutrients. The reason for the higher feeding rate in Group F may not be good palatability, but may be a self-compensation mechanism in the Taiwanese loach, which uses a high feeding rate to compensate for low feed efficiency to finally meet its own nutritional and metabolic needs. Similar phenomena have been observed in the cod [15,16].
Because the intestinal tract of fish lacks cellulase, cellulose is difficult to be hydrolyzed by these animals [1]. High fiber levels might reduce the utilization rate of other nutrients [17]. Indeed, addition of cellulose in feed slows down the growth of flounder and decreased the PER [18]. Dioundick and Stom et al. [2] also showed that the best FCR and PER are obtained with 2.5-5% supplemental fiber. However, growth was inhibited in the cellulose Group supplemented with 10%. The results of this study corroborated previous reports. The lowest FCR was in Group E, followed by Group D. Fiber content had a significant effect on the PER in the loach, and Group E had the highest PER, followed by Group D. These results showed that a suitable fiber content could reduce the FCR in the loach, improve the PER, and yield optimal growth.
Digestibility is an important index for evaluating feed absorption and utilization in the Taiwanese loach. Studies have found that fiber seems to be a relatively inert feed component, which might reduce the ADCd of the Atlantic cod, Atlantic salmon and rainbow trout [15,19-23]. However, in studies assessing the Sharpsnout Seabream, Atlantic cod and Nile tilapia, the ADCp was not affected by fiber amount increase [3,10,21,22]. Similar results were found in tilapia; Ulloa-Rojas et al. [24] found that adding coffee peel (mainly cellulose) to tilapia feed does not affect the digestibility of carbohydrates (starch and saccharide) at levels as high as 10.6%, but increased protein digestibility. Altan and Korkut et al. [5] pointed out that low dietary fiber concentration (3-5%) might be beneficial to fish growth, but high dietary fiber (>8%) might reduce the ADCd and the utilization rate of other nutrients. In this study, fiber content had a significant effect on digestibility in the loach; it showed an increasing trend first before decreasing. It may be that a suitable content of fiber as diluent and volume expander for other nutrients could expand the contact area between food ingredients and digestive enzymes, improving the digestion and absorption of nutrients, stimulating gastrointestinal movement and promoting digestion. However, too high fiber level reduced the absorption of essential nutrients by the loach. These observations were similar to those of Anderson et al. [17], with high fiber level found to reduce the utilization rate of other nutrients. This may be due to excessive amounts of cellulose, which lead to a faster rate of nutrients passing through the digestive tract, shorter digestion time and lower digestibility [14]. It has also been pointed out that dietary fiber and saccharide can affect the digestion time and change the digestibility of nutrients by fish [25,26].
Dunaif and Schneeman et al. [27] assessed the effect of dietary fibers on amylase activity in humans, and provided evidence that soluble versus insoluble fibers inhibit amylase activity. Sushil et al., [28] took cellulose (or wheat bran) as an example to evaluate the effect of cellulose on alpha-amylase activity. The results showed that cellulose could bind to alpha-amylase and inhibit its activity through a mixed inhibition mechanism. Even a small amount of cellulose could significantly inhibit alpha-amylase activity, corroborating the current study, with increased fiber content significantly reducing alpha-amylase activity.
As a product of lipid peroxidation, the higher the MDA content, the more serious the membrane damage [29]. SOD is an important antioxidant enzyme [30], which can eliminate harmful substances produced by fish during metabolism and improve immune function. It has been experimentally demonstrated that the higher the activities of antioxidant enzymes, the better the animal health and metabolism [31]. In this study, dietary fiber content had a significant effect on liver MDA amounts in the Taiwanese loach (P<0.05), showing a decreasing trend first before increasing. However, fiber content in this study had no significant effect on liver SOD activity in the Taiwanese loach, but groups D and F had relatively higher activities than the other groups. These findings indicated that the fiber content may improve the antioxidant ability of the Taiwanese loach, which may be due to the introduction of β-glucan into the feed by fiber addition; meanwhile, an appropriate amount of β-glucan is known to improve immunity [32,33].
Different highest dietary fiber levels have been reported in fish: <15.5%, 10% [34], <8% and <7%. Meanwhile, Altanand Korkut also pointed out that low dietary fiber concentration (3% to 5%) may be beneficial to fish growth. Dioundick and Stom et al. [2] found that the best growth rate, survival rate, feed conversion ratio and protein efficiency ratio are obtained with 2.5-5% supplemental fiber. In this study, the optimal supplemental amount of crude fiber ranged from 5.52% to 5.65%, which was different from the above results. The optimal dietary fiber content differs among species, which may be due to the way fibers are added to the feeds or different dietary habits of fish.
Conclusion
An appropriate fiber amount can reduce nutrient intake, improve the digestive and absorptive capacities, ameliorate the feed conversion ratio and apparent digestibility coefficient, promote growth in the Taiwanese loach, and improve the animal’s antioxidant capacity. Based on the above findings, the optimal crude fiber amount in the feed of the Taiwanese loach ranges from 5.52% to 5.65%.
Acknowledgment
The authors would like to thank the students in the aquatic animal physiology and ecology laboratory of Hebei Normal University for help and support during experiment.
Funding
This research was financially supported by the Hebei Province Modern Agricultural Technology System Freshwater Aquaculture Innovation Team Project (HBCT2018180205).
REFERENCES
- Sinha AK, Kumar V, Makkar PS. Non-starch polysaccharides and their role in fish nutrition-A review. Food Chemistry. 2011; 127: 1409-1426.
- Dioundick OB, Stom DI. Effects of dietary α-cellulose levels on the juvenile tilapia, Oreochromis mossambicus (Peters). Aquaculture. 1990; 91: 311–315.
- Adamidou S, Rigos G, Mente E. The effects of dietary lipid and fibre levels on digestibility of diet and on the growth performance of sharpsnout seabream (Diplodus puntazzo). Mediterranean Marine Science. 2011; 12: 401-412.
- Bou M, Todorčević M, Fontanillas R. Adipose tissue and liver metabolic responses to different levels of dietary carbohydrates in gilthead sea bream (Sparus aurata). Comparative Biochemistry and Physiology Part A: Molecular & Integrative Physiology. 2014; 175: 72–81.
- Altan O, Korkut AY. Apparent digestibility of plant protein based diets by European Sea bass Dicentrarchus labrax L . Turkish Journal of Fisheries and Aquatic Sciences. 2011; 11: 87-92.
- AOAC. Official methods of analysis of the association of official analytical chemists (17th ed.). Washington, DC:Association of Official Analytical Chemists. 2000.
- ISO (2000) Animal Feeding Stuffs – Determination of Crude Fibre Content – Method with Intermediate filtration. Geneva, Switzerland:International Organization for Standardization (Standard No. 6865:2000).
- Orbea A, Ortiz-Zarragoitia M, Solé M. Antioxidant enzymes and peroxisome proliferation in relation to contaminant body burdens of PAHs and PCBs in bivalve molluscs, crabs and fish from the Urdaibai and Plentzia estuaries (Bay of Biscay). Aquatic Toxicology. 2002; 58: 75–98.
- Ohkawa H, Ohishi N, Yagi K. Assay for lipid peroxides in animal tissues by thiobarbituric acid reaction. Analytical Biochemistry. 1979; 95: 351–358.
- Amirkolaie AK, Leenhouwers JI, Verreth AJ. Type of dietary fibre (soluble versus insoluble) influences digestion, faeces characteristics and faecal waste production in Nile tilapia (Oreochromis niloticus L.). Aquaculture Research. 2005; 36: 1157-1166.
- Bonvini E, Bonaldo A, Parma L. Feeding European sea bass with increasing dietary fibre levels: Impact on growth, blood biochemistry, gut histology, gut evacuation. Aquaculture. 2018; 494: 1-9.
- Hilton JW, Atkinson JL, Slinger SJ. Effect of increased dietary fiber on the growth of rainbow trout (Salmo gairdneri). Canadian Journal of Fisheries and Aquatic Sciences. 1983; 40: 81–85.
- Bromley PJ, Adkins TC. The influence of cellulose filler on feeding, growth and utilization of protein and energy in rainbow trout, Salmo gairdnerii Richardson. Fish Biology. 1984; 24: 235–244.
- Krogdahl A, Hemre GI, Mommsen TP. C rbohydrates in fish nutrition: digestion and absorption in postlarval stages. Aquaculture Nutrition. 2005; 11: 103–122.
- Lekva A, Hansen AC, Rosenlund G. Energy dilution with alpha-cellulose in diets for Atlantic cod (Gadus morhua L.) juveniles – effects on growth, feed intake, liver size and digestibility of nutrients. Aquaculture. 2010; 300: 169–175.
- Toppe J, Aksnes A, Hope B. Inclusion of fish bone and crab byproducts in diets for Atlantic cod, Gadus morhua. Aquaculture. 2006; 253: 636–645.
- Anderson JS, Jackson AJ, Matty AJ. Effects of dietary carbohydrate and fiber on the tilapia, Orechromis niloticus (Linn.). Aquaculture. 1984; 37: 303-314.
- Lee SM, Kim KD, Lall SP. Utilization of glucose, maltose, dextrin and cellulose by juvenile flounder (Paralichthys olivaceus). Aquaculture. 2003; 221: 427–438.
- Glencross B. The influence of soluble and insoluble lupin non-starch polysaccharides on the digestibility of diets fed to rainbow trout (Oncorhynchus mykiss). Aquaculture. 2009; 294: 256–261.
- Glencross B, Rutherford N, Bourne N. The influence of various starch and nonstarch polysaccharides on the digestibility of dies fed to rainbow trout (Oncorhynchus mykiss). Aquaculture. 2012; 356:141–146.
- Hansen AC, Rosenlund G, Karlsen Ø. Total replacement of fish meal with plant proteins in diets for Atlantic cod (Gadus morhua L.) I - Effects on growth and protein retention. Aquaculture. 2007; 272: 599–611.
- Hansen JØ, Storebakken T. Effects of dietary cellulose level on pellet quality and nutrient digestibilities in rainbow trout (Oncorhynchus mykiss). Aquaculture. 2007; 272: 458–465.
- Kraugerud OF, Penn M, Storebakken T. Nutrient digestibilities and gut function in Atlantic salmon (Salmo salar) fed diets with cellulose or non-starch polysaccharides from soy. Aquaculture. 2007; 273: 96-107.
- Ulloa-Rojas JB. Use of coffee pulp as feed ingredient for tilapia culture. Dissertation, Wageningen University. 2002.
- Eusebio PS, Coloso RM, Mamauag EP. Apparent digestibility of selected ingredients in diets for juvenile grouper, Epinephelus coiodes (Hamilton). Aquaculture Research. 2004; 35: 1261–1269.
- Zhou QC, Tan BP, Mai KS. Apparent digestibility of selected feed ingredients for juvenile cobia Rachycentron canadum. Aquaculture. 2004; 241: 441–451.
- Dunaif G, Schneeman B. The effect of dietary fiber on human pancre-atic enzyme activity in vitro. The American Journal of Clinical Nutrition. 1981; 34: 1034–1035.
- Sushil D, Michael JG, Frederick JW. Inhibition of α-amylase activity by cellulose: Kinetic analysis and nutritional implications. Carbohydrate Polymers. 2015; 123: 305-312.
- Xu L, Ran C, He SX. Effects of dietary yeast nucleotides on growth, non-specific immunity, intestine growth and intestinal microbiota of juvenile hybrid tilapia Oreochromis niloticus, ♀ × Oreochromis aureus, ♂. Animal Nutrition. 2015; 1: 244-251.
- Meng QG, Chen J, Xu CC. The characterization, expression and activity analysis of superoxide dismutases (SODs) from Procambarus clarkii. Aquaculture. 2013; 406: 131-140.
- Wu CL, Ye JY, Gao JE. The effects of dietary carbohydrate on the growth, antioxidant capacities, innate immune responses and pathogen resistance of juvenile Black carp Mylopharyngodon piceus. Fish & Shellfish Immunology. 2016; 49: 132–142.
- Guzmán-Villanueva LT, Ascencio-Valle F, Macías-Rodríguez ME. Effects of dietary β-1,3/1,6-glucan on the antioxidant and digestive enzyme activities of Pacific red snapper (Lutjanus peru) after exposure to lipopolysaccharides. Fish Physiol Biochem. 2014; 40: 827-837.
- Zhao HX, Cao JM, Wang AL. Effect of long-term administration of dietary β-1,3-glucan on growth, physiological, and immune responses in Litopenaeus vannamei (Boone, 1931). Aquaculture International. 2012; 20:145-158.
- NRC. Nutrient Requirements of Fish and Shrimp. The National Academies Press, Washington, D.C., USA. 2011.
Citation: Sun Y, Zhao X, Liu H, Yang Z (2019) Effect of Fiber Content in Practical Diet on Feed Utilization and Antioxidant Capacity of Loach, Misgurnus anguillicaudatus). 10: 577. doi: 10.35248/2155-9546.19.10.577
Copyright: © 2019 Sun Y, et al. This is an open access article distributed under the term of the Creative Commons Attribution License, which permits unrestricted use, distribution, and reproduction in any medium, provided the original work is properly cited.
Sources of funding : This research was financially supported by the Hebei Province Modern Agricultural Technology System Freshwater Aquaculture Innovation Team Project (HBCT2018180205).