Indexed In
- Genamics JournalSeek
- Academic Keys
- JournalTOCs
- China National Knowledge Infrastructure (CNKI)
- Access to Global Online Research in Agriculture (AGORA)
- Centre for Agriculture and Biosciences International (CABI)
- RefSeek
- Directory of Research Journal Indexing (DRJI)
- Hamdard University
- EBSCO A-Z
- OCLC- WorldCat
- Scholarsteer
- SWB online catalog
- Publons
- Euro Pub
- Google Scholar
Useful Links
Share This Page
Journal Flyer
Open Access Journals
- Agri and Aquaculture
- Biochemistry
- Bioinformatics & Systems Biology
- Business & Management
- Chemistry
- Clinical Sciences
- Engineering
- Food & Nutrition
- General Science
- Genetics & Molecular Biology
- Immunology & Microbiology
- Medical Sciences
- Neuroscience & Psychology
- Nursing & Health Care
- Pharmaceutical Sciences
Research Article - (2019) Volume 10, Issue 9
Development and Evaluation of a Non-Dairy Probiotic Beverage from Brown Rice (Oryza sativia)
Joel Ndife*, Adindu Linus-Chibuezeh, Vanessa C. Ezeocha and Maureen C. OjinnakaReceived: 01-Jul-2019 Published: 26-Jul-2019, DOI: 10.35248/2157-7110.19.10.806
Abstract
The development of functional foods to promote health is currently of global relevance. Prebiotics are food ingredients that exert beneficial health effects on the host by stimulating the growth of probiotics. This work examined the potential of brown rice in the production of probiotic beverage (PB) inoculated with Lactobacillus acidophilus and Streptococcus thermophillus. The beverage quality and probiotic viability were evaluated over 4 weeks storage and compared with a control beverage (CB) which was produced without inoculation. The physicochemical analyzes result showed viscosity of PB (601-1200 cp) to be higher than CB (500-550 cp). The specific gravity of PB (0.99-1.90) was not significantly different from CB (1.00-1.92). The % Brix increased more in PB (6.10-7.00) than in CB (4.90-6.50). There was more reduction in pH in a probiotic beverage (5.32-4.77) than in the control (6.21-5.96). The total microbial count at the end of fermentation ranged from 3.3 × 10⁸ to 4.1 × 10⁹ CFU/ml for PB and 1.0 × 101 to 3.3 × 10³ CFU/ml for the control sample CB. There were no detectable fungi and coliform growths in the probiotic sample (PB). However, a range of 1.1 × 101 to 4.2 × 10³ CFU/ml fungi and <1.0 × 101 CFU/ml coliforms were observed in the control (CB). Lactobacillus acidophilus (5.0 × 10⁶ to 2.9 × 10⁷) CFU/ml proliferated more compared to Streptococcus thermophillus (2.0 × 10⁵ to 3.2 × 10⁶) CFU/ml in the probiotic sample (PB) but lagged in the control sample (CB). The beverages differed significantly (p ≥ 0.05) with respect to overall sensory acceptability. The inoculated beverage (PB) showed better acceptance than the non-fermented beverage (CB). At the end of 4 weeks of evaluation, the inoculated brown rice beverage was able to support high probiotic cell viability which confirms its prebiotic potential.
Keywords
Prebiotic; Probiotic; Brown rice; Physico-chemical; Beverage
Introduction
Recently the growing awareness of consumers on the relationship between food and health has led to increasing demand for functional foods which provide health benefits further than the basic function of contributing nutrients [1]. Furthermore, functional foods are defined as foods that in addition to their basic nutrients contain biologically active components in an adequate amount which have a positive impact on the health of the consumer [2,3]. Such foods improve health conditions when consumed, by reducing the risk of diseases [4,5].
One way of creating a functional food is by the inclusion of ingredients such as probiotics and prebiotics to levels that enable the consumer to derive optional health benefits [6,7]. Prebiotics are non-digestible food ingredients that beneficially affect the host by selectively stimulating the growth of desired bacterial species in the colon [8]. Foods classified as prebiotics must demonstrate that they are not broken down in the stomach or absorbed in the gastrointestinal tract [3].
Probiotics are live microorganisms which upon ingestion in adequate quantity impart health benefits to the host animal beyond inherent basic nutrition [9]. They are live microorganisms that are created as food supplements in order to promote health for consumers by adjusting microbial balance in the intestine [10]. Lactobacillus and Bifidobacteria species in the intestinal tract are considered as the commonest probiotic bacteria. Loosing probiotic during processing is the most important technological obstacle that must be solved [1]. Most probiotic foods in the markets are milk-based and very few attempts are made for the development of probiotics foods using other fermentation substrates such as cereals [11].
Cereals are very important staple crops that is consumed worldwide. They are readily available and are important sources of nutrients and bioactive compounds. Cereal grains are very good substrates for lactic acid fermentation [12,13]. The choice of cereal-based substrate for the development of probiotic foods is motivated by the increase in consumer vegetarianism, lactose intolerance, milk protein allergies, cholesterol phobia, and economic reasons that are associated with the consumption of dairy products. Cereals also have the potentials to offer the consumer some prebiotic benefits [13,14].
Therefore, the interest in the development of non-dairy products using cereals is increasing due to consumers’ interest in an exotic taste and better well-being. Therefore, the aim of this work was to investigate the prebiotic potential of brown rice and to evaluate the physicochemical, microbial quality and sensory acceptance of the probiotic beverage.
Formulations of flavor from aroma chemicals are used globally for imparting attractive taste and aroma to processed foods and beverages. The worldwide flavor generally earns returns in excess of the chemical industry average. The industry ’ s close association with the health, food and beverage markets means that its revenues are relatively stable, largely insensitive to commodity cycles and relatively recession-resistant [8]. One of the responsibilities of professionals is to alleviate the societal and governmental challenges by doing research to secure food and beverage products from industries.
Materials and Methods
Material procurement
Materials for this work; brown rice, honey, and commercial starter culture, were sourced from Central Market Kaduna, in Nigeria. The commercial probiotic starter culture mini-sachets were also purchased from pharmacy shop in Kaduna. The chemicals and reagents used were of scientific standards. The equipment and utensils used were standardized for the purpose of this research.
Product formulation
The proportion of ingredients used in this work is presented in Table 1.
| Ingredient | CRB | PRB |
|---|---|---|
| Brown rice (g) | 500 | 500 |
| Honey (ml) | 25 | 25 |
| Water (ml) | 1000 | 1000 |
| Vanilla flavor (ml) | 5 | 5 |
| Starter culture (g) | Nil | 10 g |
Table 1: Product formulation.
Preparation of probiotic starter cultures
Commercial probiotic starter cultures (Yo-Flex-L812), a highly concentrated yogurt starter culture of Lactobacillus acidophilus and Streptococcus thermophilus was prepared as liquid inoculum by dissolving 10 g granules of the freeze-dried probiotic starter cultures in 10 ml (w/v) of distilled warm (37°C) water.
Production of probiotic rice-milk beverage
Brown rice (500 g) was sorted and soaked in water for 2 h. After soaking the rice was drained to remove the water after which it was cooked with one and a half liters of water (w/v) for about 30 min. The cooked brown rice and water was allowed to cool to ambient temperature, was ground in a Molineux blender into a milk-like slurry and sieved to reduce the solid matter for uniformity. Honey (25 ml) was added as a sweetener and mixed thoroughly. The rice milk was pasteurized for 10 min at 85°C and after which it was cooled to 40°C. The rice slurry was then mixed with the prepared probiotic starter culture (20 ml) and vanilla liquid flavor (5 ml). After inoculation, the mix was stirred uniformly with a stirrer and incubated at 45°C for 24 h. After which, the beverage was filled into containers, labeled as PB and stored in a refrigerator at 7°C. The same procedure was adopted for the control without the probiotic starter culture (CB). Brown rice (500 g) was sorted and soaked in water for 2 h. After soaking the rice was drained to remove the water after which it was cooked with one and a half liters of water (w/v) for about 30 min. The cooked brown rice and water were allowed to cool to ambient temperature, was ground in a Molineux blender into a milk-like slurry and sieved to reduce the solid matter for uniformity. Honey (25 ml) was added as a sweetener and mixed thoroughly. The rice milk was pasteurized for 10 min at 85°C and after which it was cooled to 40°C. The rice slurry was then mixed with the prepared probiotic starter culture (20 ml) and vanilla liquid flavor (5 ml). After inoculation, the mix was stirred uniformly with a stirrer and incubated at 45°C for 24 h. After which, the beverage was filled into containers, labeled as PB and stored in a refrigerator at 7°C. The same procedure was adopted for the control without the probiotic starter culture (CB).
Methods of analysis
Physico-chemical analysis: The protocols of Onwuka [15] were adopted in the determination of the physicochemical properties of the beverage samples, viz:
The pH meter was standardized with the buffer 7 solution. 50 ml of the sample was measured into a beaker and the electrode of the pH meter was dipped into the samples and the corresponding pH value was recorded.
A viscometer was used to determine the viscosity of the samples. Spindle size of 4 mm diameter was used in the viscotester and the corresponding value of the flow resistance of the sample at 28°C was recorded.
Pycnometer bottle was used to determine the specific gravity. The pycnometer bottle was thoroughly washed with detergent, water, and petroleum ether, it was dried and the weight recorded. After drying, it was filled with the sample and weighed and the result was used to determine the specific gravity of the sample at 20°C.
A smear of the sample was placed on the glass prism of the Abbe refractometer and was viewed under natural light through the lens. The sugar content of the samples was recorded as percentage Brix.
Microbial assay: The methods described by APHA [16] were adopted in the enumeration of total bacteria, total fungi, Lactobacillus and Streptococcus spp.
Enumeration of bacteria and fungi: The samples (25 ml) were homogenized with 225 ml of sterile 0.1% (v/v) peptone water. Decimal dilutions were prepared to give 1:10 serial dilutions and the aliquots were plated in triplicates on specified media. The plate count agar was used for the total viable bacteria counts and potato dextrose agar with 10% tartaric acid to suppress the growth of bacteria for the total fungi counts. The media were allowed to solidify and then incubated at 37°C for 24hr for bacteria and (72-120) hr for the growth of fungi. The colonies of each plate were counted. The colony counts were expressed in colony-forming units (CFU/g).
Enumeration of probiotic microorganisms: The viability of probiotics was determined immediately after production and at 2 weeks intervals during storage. The beverage samples (10 g) were homogenized and serially diluted with sterile peptone water of 1:10 serial dilutions. One ml of the aliquot dilutions were pour plated in triplicate on MRS agar for L. acidophilus and Streptococcus agar (M17 agar) was used for S. thermophilus. The plates were incubated at (38 ± 1)°C for 72hr under the aerobic condition for L. acidophilus and anaerobic condition for S. thermophilus. The bacterial viability was represented as the survival rate. The number of colonies appearing in the incubated plates of the respective media were counted, averaged and expressed as colony-forming units per gram (CFU/ml).
Sensory evaluation
The samples were subjected to sensory evaluation based on appearance, aroma, texture, taste and overall acceptability sensory attributes. The 20 member panelists were asked to taste and grade the samples and record their scores on a 9-point Hedonic scale that ranged from 9-liked extremely, 5-neither liked nor disliked and 1-disliked extremely [17].
Statistical analysis
The analyses were conducted in duplicates, means and standard deviations were computed using Statistical Package for Social Sciences (SPSS) version 21. Means were separated using Duncan Multiple Range Test of SPSS software.
Results and Discussion
Physicochemical properties of beverage samples
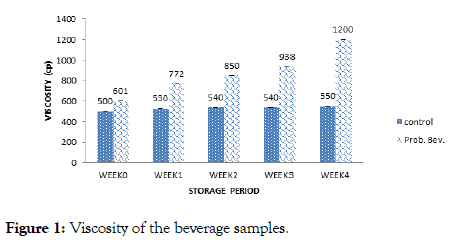
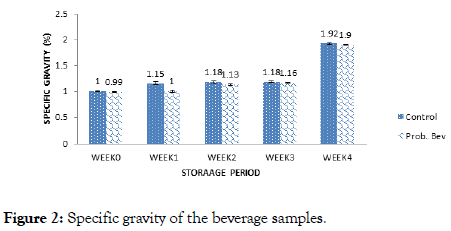
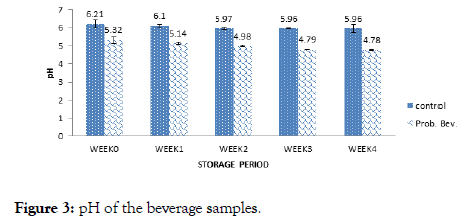
The beverages were analyzed for viscosity, pH, specific gravity and sugar content immediately after production and at the oneweek interval for a period of four weeks. The results of the physicochemical properties of probiotic beverage and control sample are presented in Figures 1-4.
Figure 1. Viscosity of the beverage samples.
Figure 2. Specific gravity of the beverage samples.
Figure 3. pH of the beverage samples.
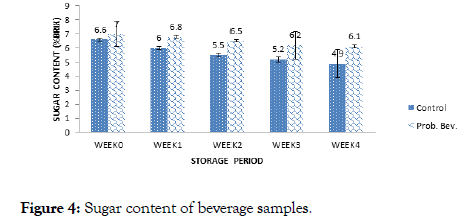
Figure 4. Sugar content of beverage samples.
Viscosity result (Figure 1) showed a range of 500 cp (week 0) to 550 cp (week 4) and 601cp (week 0) to 1200 cp (week 4) for the control and probiotic samples respectively. The viscosity of the samples increased with storage duration. Fermentation increased the viscosity of the probiotic sample progressively which was significantly higher than values obtained for the control sample. Values obtained for viscosity was higher than (3.90-7.1) cp reported by Thakur and Sharma [18] for probiotic pomegranate beverage. The increase in viscosity could be due to coagulation of the rice milk and increase in biomass density of the microbes [13].
The specific gravity of the samples ranged from (1-1.92)% and (0.99-1.90)% for the probiotic and control samples respectively (Figure 2). Fermentation and storage duration had a slight effect on specific gravity. However, during the fourth week of storage, a progressive increase in specific gravity was observed, and this could be attributed to the fact that the samples became cloudier during this period.
The pH of the samples decreased from 5.32 to 4.79 for the probiotic drink and 6.21 to 5.96 for the control with storage. The pH helps to determine the acidity and alkalinity of foods. According to Granato [12] and Ndife [3]. Lactobacillus and Streptococcus species are lactic acid-producing microbes. The starch component of brown rice during fermentation was converted to lactic acid by the probiotics, thus lowering the pH of the food sample. Lactic acid bacteria are neutrophilic, that is, have optimum growth pH between 5 and 9 [11,19]. This could be the reason why the probiotic counts dropped with the reduction in pH after 3 weeks of storage.
Sugar content ranged from 4.90-6.50% for the control and 6.10-7.00% Brix for the probiotic drink during 4 weeks of storage. Storage duration affected sugar content as observed in Figure 4. There was a significant difference (p>0.05) in the sugar content of the samples with the storage period. Thakur and Sharma [18] reported total sugar content of 13.14% Brix for probiotic pomegranate beverage which was significantly higher than the observed values in this study.
The microbial content of beverage samples
Total viable bacteria yeast and coliform counts are presented in Table 2. The total viable count showed a range of less than (1.0 × 101 to 3.3 × 10³) CFU/ml for the control sample, and a higher count of (3.3 × 10⁸ to 4.1 × 10⁹) CFU/ml was observed for the probiotic drink. Higher bacterial count recorded for the probiotic product showed that the inoculated bacteria species proliferated as per expectation. There was no visible fungi growth in the probiotic sample, however, a range of 1.1 × 101 to 4.2 × 10³ CFU/ml was observed for the control. This is an indication that wild microorganisms did not contaminate the probiotic samples even during storage. The proliferation of unwanted organisms will have a negative effect on the quality of the product and may lead to foodborne diseases when consumed [7,18]. Coliform was not detected in the probiotic sample, whereas, a slight increase (<1.0 × 101 CFU/ml) was detected in the control sample during storage. This was an indication of the hygienic quality of the samples.
| Sample/treatment | Total Bacteria count (cfu/ml) | Total Fungi count (cfu/ml) | Coliform count (cfu/ml) | |
|---|---|---|---|---|
| Week 0 | CB | <1.0 × 101 | 1.1 × 101 | Nil |
| PB | 3.3 × 10⁸ | Nil | Nil | |
| Week 1 | CB | 1.2 × 10² | 2.4 ×10² | Nil |
| PB | 4.0 × 10⁸ | Nil | Nil | |
| CB | 1.6 × 10² | 2.1 × 10³ | <1.0 × 101 | |
| Week 2 | PB | 2.1 ×10⁹ | Nil | Nil |
| CB | 3.0 × 10³ | 3.2 × 10³ | <1.0 × 101 | |
| Week 3 | PB | 3.4 × 10⁹ | Nil | Nil |
| CB | 3.3 × 10³ | 4.2 103 | <1.0 × 101 | |
| Week 4 | PB | 4.1 × 10⁹ | Nil | Nil |
Table 2: Microbial counts of samples.
Probiotic viability in beverage samples
The viability of the two probiotics is presented in Table 3. The result showed the rapid growth of Lactobacillus and Streptococcus species, and this continued during storage for up to 4 weeks. Lactobacillus acidophilus (5.0 × 10⁶ to 2.9 × 10⁷ CFU/ml) proliferated more compared to Streptococcus thermophilus (2.0 × 10⁵ to 3.2 × 10⁶) CFU/ml) for the probiotic sample (PB). Brandao et al. [19] reported an initial count of 1014 CFU/ml for soy beverage inoculated with Lactic acid bacteria. The count of beneficial bacteria (probiotics) must be in the range of 106-109 for a product to be called probiotic [3,13,20] and this range was attained by the probiotics used. This showed that both Lactobacillus acidophilus and Streptococcus thermophile grew and retained their viability during storage and is likely to provide the desired probiotic benefits.
| Sample/treatment | Lactobacillus spp | Streptococcusspp | |
|---|---|---|---|
| (cfu/ml) | (cfu/ml) | ||
| Week 0 | CB | <1.0 × 101 | <1.1 × 101 |
| PB | 5.0 × 10⁶ | 2.0 × 10⁵ | |
| CB | <1.0 × 101 | <1.0 × 101 | |
| Week 1 | PB | 6.0 × 10⁶ | 2.5 × 10⁵ |
| CB | <1.0 × 101 | <1.0 × 101 | |
| Week 2 | PB | 1.9 × 10⁸ | 3.0 × 10⁶ |
| CB | <1.0 × 101 | <3.0 × 10² | |
| Week 3 | PB | 2.7×10⁸ | 3.3 × 10⁷ |
| CB | <1.0 × 101 | <3.0 × 10² | |
| Week 4 | PB | 2.9 × 10⁷ | 3.2 ×10⁶ |
Table 3: Viable counts of probiotics.
Sensory acceptability of beverage samples
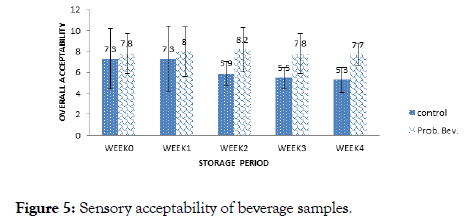
The overall sensory acceptability of the beverage samples is presented in Figure 5. Sensory scores of the control sample ranged from 5.3 to 7.3 while the range of 7.7 to 8.2 was obtained for the probiotic sample. It was observed for the control that panelists ’ preference decreased with storage. Maximum sensory score of 7.3 was obtained in week 0 and week 1 while the minimum score was obtained in week 4 for the control sample. On the hand, panelists ’ preference for the probiotic beverage increased with storage period up to week 2 with an average score of 8.2 which translates to ‘like very much’ on the Hedonic scale. There was a significant difference (p<0.05) in the over the acceptability of the samples after storage. It can be deduced, that panelists preferred the Probiotic Beverage (PB) more than the Control Sample (CB) and this increased with storage. Increased viscosity and low pH of the probiotic samples could be cogent reasons for panelists ’ preference. A vast number of volatile compounds include acids, higher alcohols, carbonyls, and esters are synthesized and modulated by probiotics during fermentation, which significantly imparts the overall quality of the product [11,13,21].
Figure 5. Sensory acceptability of beverage samples.
Conclusion
This study showed that brown rice is a suitable substrate that can support high probiotic cell viability for up to 4 weeks. It is evident that the inoculated beverage (PB) supported the survival of the probiotic microbes and had better quality parameters as evaluated compared to the control sample (CB). More so, a sensorial acceptable probiotic beverage was produced from brown rice which unlike the control sample improved with storage time, which confirms that brown rice possesses prebiotic quality.
REFERENCES
- Ukeyima MT, Enujiugha VN, Sanni TA. Review: Current applications of probiotic foods in Africa. Afr J Biotech. 2010;9(4):394-401.
- Berner LA, O’Donnell JA. Functional foods and health claims: Application to dairy foods. Int Dairy J. 1998;8:355-362.
- Ndife J. Functional Foods: Basics, ingredients and application. Amotees link Services and Publishers, Kaduna, Nigeria. 2016:156.
- Siro IN, Kapolna E, Kapolna BT, Lugasi A. Functional food product development, marketing and consumer acceptance-A review. Appetite. 2008;51(3):456-467.
- Prado FC, Parada JL, Pandey A, Soccol CR. Trends in non-dairy probiotic beverages. Food Res Int. 2008;41:111-123.
- Marchand J, Vandenplas Y. Microorganisms administered in the benefit of the host: myths and facts. Euro J Gastro Hepato. 2000;12(10):1077-1088.
- Iwe MO. Handbook of Sensory Methods and Analysis. 2nd Edition. Rojoint Communication Services Ltd, Enugu, Nigeria. 2010.
- Mohammadi R, Mortazavian AM. Review: Technological aspects of prebiotics in probiotic fermented milks. Food Rev Int. 2011;27:192-212.
- Shukla PKA. Development of probiotic beverage from whey and orange. J Nutr Food Sci. 2017;7:629.
- Sanz Y. Ecological and functional implications of the acid-adaptation ability of Bifidobacterium: away of selecting improved probiotic strains. Int Dairy J. 2007;17:1284-1289.
- Ziemer CJ, Gibson GR. An Overview of probiotics, prebiotics and synbiotics in the functional food concept: Perspectives and future strategies. Int Dairy J. 1998;8:473-479.
- Granato D, Branco G, Nazzaro F, Cruz A, Faria J. Functional foods and nondairy probiotic food development: trends, concepts, and products. Compr Rev Food Sci Food Safety. 2010;9:292-302.
- Ezeama CF. Food Microbiology: Fundamentals and applications. Natural Prints Ltd., Lagos. 2007:196.
- Ogunremi OR, Agrawal R, Sanni AI. Development of cereal-based functional food using cereal-mix substrate fermented with probiotic strain-Pichia kudriavzevii OG32. Food Sci Nutr. 2015;3(6):486-494.
- Onwuka GI. Food Science and Technology. Napthali Publishers, Ikeja, Lagos, Nigeria. 2014:175.
- Onwuka GI. Food Analysis and Instrumentation, Naphthal prints, Lagos, Nigeria. 2018:324.
- APHA. Compendium of methods for the microbiological examination of foods. (4th ed). American Public Health Association, Washington, DC. USA. 1992.
- Thakur M, Sharma RK. Development of probiotic pomegranate beverage and its physio-chemical and microbial characterization. Int J Pure Appl Biosci. 2017;5(1):35-41.
- Brandao H, Brach E, Mendonça S, Brandão W, Coelho S. Christ D. Development of probiotic cultures in a symbiotic soy beverage using different types of carbohydrate. Afr J Microbiol Res. 2013;7(20):2251-2258.
- Shah NP. Functional foods from probiotics and prebiotics. Food Tech. 2001;55(11):148-149.
- Ndife J, Offor N, Awogbenja D. Production and quality evaluation of probiotic beef sausage. Pak J Nutr. 2019;18(7):686-691.
Citation: Ndife J, Linus-Chibuezeh A, Ezeocha CV, Ojinnaka CM (2019) Development and Evaluation of a Non-Dairy Probiotic Beverage from Brown Rice (Oryza sativia). J Food Process Technol 10:806. doi: 10.35248/2157-7110.19.10.806
Copyright: © 2019 Ndife J, et al. This is an open-access article distributed under the terms of the Creative Commons Attribution License, which permits unrestricted use, distribution, and reproduction in any medium, provided the original author and source are credited.
