

Indexed In
- Genamics JournalSeek
- JournalTOCs
- CiteFactor
- RefSeek
- Hamdard University
- EBSCO A-Z
- OCLC- WorldCat
- Publons
- Google Scholar
Useful Links
Share This Page
Journal Flyer

Open Access Journals
- Agri and Aquaculture
- Biochemistry
- Bioinformatics & Systems Biology
- Business & Management
- Chemistry
- Clinical Sciences
- Engineering
- Food & Nutrition
- General Science
- Genetics & Molecular Biology
- Immunology & Microbiology
- Medical Sciences
- Neuroscience & Psychology
- Nursing & Health Care
- Pharmaceutical Sciences
Research Article - (2021) Volume 10, Issue 6
Determination of Acoustic Characteristics of Melamine foam with Experimental Validation
Behzad Ahmed Zai*, Saad Sami and Rashid AliReceived: 27-Feb-2021 Published: 12-Apr-2021, DOI: 10.35248/2168-9873.21.10.366
Abstract
Space launch vehicles experience severe dynamic loadings throughout the flight. Acoustic loads are one such load that is very critical to the launch vehicle at the time of ignition and take off. The amplitudes of acoustic loadings are generally very high and required to be diminished to save electronic components. Typically, one of the most common and efficient insulating materials is Melamine Foam (MF). This paper analyses the acoustic and environmental noise reduction using MF panels of variable thicknesses (25, 50, and 75 mm). Commercial FEA software is used to estimate the acoustic parameters, which are experimentally, validated using an impedance tube based on the transfer matrix method. The impedance tube can measure the normal incident sound absorption coefficient and transmission loss for the frequency range of 64 Hz to 6.2 kHz. A conventional, two-microphone impedance tube is connected to a sample holder downstream of the first microphone pair and a section downstream of the sample holder that accommodates a second pair of microphones. Two separate arrangements of impedance tubes are used to measure the absorption coefficient and transmission loss. The FEA and experimental results are compared and found in good agreements. Furthermore, the optimized insulation foam thickness is obtained based on required acoustic parameters.
Keywords
Melamine foam; Absorption coefficient; Transmission loss; Sound pressure level; Impedance tube
Introduction
In space missions, satellite launch system encounters a wide range of broadband noise loads. Therefore, acoustic emission and transmission must be studied during a launch system's critical instants, including maximum dynamic pressure condition, transonic flight condition, and lift off. The upper stages of the launch system are subjected to extreme broadband and random acoustic excitation. The high-velocity jet noise emitted from the rocket boosters is reflected back to the payload from the launching platform at the lift-off time, consequently compromising the entire mission. Sound pressure level (SPL) inside a fairing cavity could reach 120–140 dB, which can cause significant damage to sensitive elements (e.g., solar panel and power supply). For the determination of SPL inside the fairing, a vibroacoustic environmental analysis must be carried out. Numerical prediction of vibroacoustic response of satellite launch vehicle is a pre-requisite so that the noise control engineer could effectively optimize the vehicle system [1-3].
Therefore, it is a standard operating procedure to qualify payloads under launch environment response conditions before flight [4]. While designing for acoustic noise attenuation, the upper parts of the launchers, such as payload fairing and bays, have prime importance. Passive techniques with acoustic blankets were used by Glaese and Anderson [5], they presented structural-acoustic modeling for a full-scale composite launch vehicle payload fairing. The purpose of these analyses and experimental efforts was to provide data and valid models that will be used for active acoustic control for payload fairing. Furthermore, they implemented a closed-loop acoustic transmission reduction that was measured on a full-scale composite payload fairing. Two approaches are adopted to reduce SPL in the fairing. The first is by increasing the transmission loss along the fairing's wall; this approach will increase the design cost and reduce the mass ratio of optimized design. Thus, the second approach is more commonly used to absorb the acoustic load. It is achieved with the help of an acoustic blanket of optimized thickness. For this purpose, the most frequently used porous material is MF.
Among commonly used porous materials, MF was characterized by its lightweight, high flexibility and high sound absorption coefficient within a mid-high frequency noise range [6,7]. Moreover, MF was experimentally demonstrated by the National Aeronautics and Space Administration (NASA) to have superior noise attenuation performance as traditional acoustic blankets [8-10]. Li et al. [11] paid great efforts to investigate noise reduction in a cylindrical cavity with MF lining within the low-medium frequency range (100–400 Hz). They derived natural frequencies of the cylindrical cavity with locally and non-locally reacting liners from theories of the cylindrical cavity lining. They demonstrated that MF lining could achieve noise reduction by up to 4–8 dB within the low and medium-frequency range. Furthermore, different porous material was used by many other researchers as noise attenuation blankets to attenuate sound energy by trapping and dissipating it in the form of heat [12-18].
The acoustic performance of blanket materials can be characterized in many ways since knowledge of different parameters, such as Biots parameters, are significant when acoustic noise control treatment designs are specified. Biots parameters include physical properties such as porosity, density, resistivity, tortuosity, characteristic thermal lengths, and viscosity of the material being used. These parameters are necessary for the computation of absorption and transmission loss of the acoustic foam and are usually provided by the material manufacturer; if not can be measured experimentally as presented by Lauriks [19]. In recent years, the advancement in the utilization of MF along with other materials is being carried out by different researchers. Ji et al. [20] investigated a porous labyrinthine type of acoustic metamaterials (LAMs), a sort of acoustic metasurface, analytically, numerically, and in laboratory tests. The LAMs are composed of a series of porous elements, where stainless steel plates with various lengths are inserted into the MF. Moreover, Yang et al. [21] explored the physical properties and corresponding mechanism of MF, which was modified by phenolic resin. They found out that this phenomenon had a significant effect on the pore size of MF. There was a remarkable improvement in sound transmission loss (STL) compared to that without phenolic resin. However, STLs did not increase monotonically.
The acoustic properties of porous material are first estimated analytically. Therefore, Finite Element Techniques are extensively helpful in resolving problems arising in the different industrial sectors. COMSOL is one such software being used for solving complex acoustic problems, which basically revolve around pressure waves in a fluid. The acoustics mode provides two types of analysis; Time-Harmonic and Eigen-Value [22]. Allam et al. [23] utilized COMSOL to develop acoustic models for high-frequency resonators of a Turbo-charged internal combustion engine. Using the software, the realistic flow patterns of the possible 3D effects were observed for losses incurred during combustion. Another experimental work was presented using the two-source location technique to obtain two-port matrices and four sample resonators' transmission losses with varying the mean flow speeds. Strek Tomasz [24] presented a numerical method for the calculation of frequency-dependent sound transmission loss within a reflective pipe with an outlet to an acoustic-free space using COMSOL. For experimental validation of results obtained using Finite Element Analysis (FEA), the impedance tube method is commonly used to measure the normal incident sound absorption coefficient and transmission loss for different materials [25]. Bolton et al. [26] described a method for measuring the normal incidence transmission loss and related acoustic properties of a sample placed in a four-microphone standing wave tube. Similar work was presented by Hua and Herrin [27]; they used the two-load method to determine the transmission loss of a muffler or silencer. They examined several practical measurement considerations. The use of the impedance tube is limited to measuring the acoustic parameter of porous material and is used in a variety of applications such as fluid and soil transmission loss measurements [28-30]. In this paper, the theory underlying the transfer matrix approach is described first, followed by a description of the experimental setup using the impedance tube. Various results, including the normal incidence transmission loss and absorption coefficients, are then presented for acoustic insulation of variable thickness MF both numerically and experimentally. The working frequency range is described with the placement of small and large diameter tubes. The resonance features are obtained due to sample constraints around its edges for both absorption coefficient and transmission loss. The acoustic characteristics at different MF thicknesses are presented for estimation of required insulation blanket within payload fairing to protect satellite and other electronic components from harmful noise effects.
ANALYTICAL RELATIONS
The material absorption coefficient is an important parameter that is characterized by its normal or random incidence characteristics. The ISO standard 10534-2-(1998) illustrates the well-known process to determine the absorption and impedance characteristics of noise-insulating materials through the "two microphones" or "transfer-function" method for as shown in Figure 1.

Figure 1: Two microphone impedance tube for the measurement of the absorption coefficient.
The transfer function method mainly relied upon the ratio of the sound pressures of the reflected and the incident wave at termination (at x = 0), given by Eq. (1) [31]. The absorption coefficient relation for materials is given in Eq. (2).
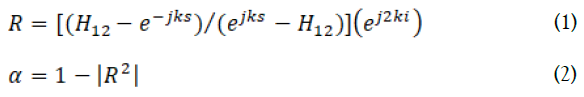
The absorption coefficient for random incidence can also be measured in a reverberant room, where the diffuse acoustic fields can be simulated with approximation. The transmission loss computation of noise absorbent materials is essential in building acoustic and environmental noise reduction studies. Internationally, the impedance tube method is widely adopted for determining the sound absorption coefficient [32]. However, there is no international standard procedure for measuring sound transmission loss when used in conjunction with the impedance tubes. Bolton et al. [33] modified a sound absorption measurement impedance tube to measure the sound transmission loss of automotive sealant materials. Ho et al. [34] measured the sound transmission of perforated panels with an impedance tube somewhat similar to Bolton's measurement system. The differences between the two are the type of sample holder and a monotonic wave. More recently, a commercial sound transmission measuring system, proposed by Ryu has become available, i.e., the B&K 4206T transmission loss tube kit. Generally, sound transmission loss measurement tubes comprise three parts: the upstream tube, the sample holder, and the downstream tube.
They implemented enclosed boundary conditions in the downstream tube with a semi-anechoic termination, whereas Ryu [35] tested with both open and closed boundary conditions during his work. The impedance tube used for computation of transmission loss is shown in Figure 2. A set of two microphones (MP1 & MP2) are mounted in the upstream tube. Similarly, two microphones (MP3 & MP4) are mounted in the downstream tube to measure both incidents and reflected waves. The reference position (x = 0) is given as the front surface of a sample x_1,x_2,x_3,x_4 denote each microphone's position. If a one-dimensional plane wave in the tube is assumed to be pe^(j(wt-kx)) then the Fourier components of the sound pressure at microphone 1, 2, 3, and 4, after eliminating the time-dependent term, can be expressed by the following equations [36].
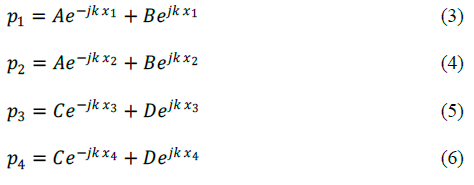
Eq. (3) - (6) can be rearranged to solve for the coefficients A to D as shown in Eq. (7) - (10)
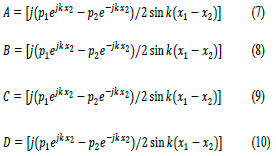

Figure 2: Four microphone impedance tube for the measurement of transmission loss.
In order to simplify the equation, the two microphones were placed at an equal distance. The transmission coefficient (T) is defined by the ratio C/A and the transmission loss (TL) equals-20 log|H_t |:

Where s=|x_1-x_2 |=|x_3-x_4 | H_12=p_2⁄p_1 is the transfer function, which is the Fourier-transform component ratio between the sound pressures at positions 1 and 2 H_34=p_4⁄p_3 is the transfer function, which is the ratio of the Fourier-transform component between the sound pressures at positions 3 and 4. H_t=√(|S_d⁄S_u|). The spectrum analyzer generated white noise, and the noise signal was simultaneously measured using all 4 microphones.
Acoustic analysis
Absorption coefficient: Absorption properties of open-cell and acoustic proofing foam are computed using the pressure acoustic model of analytical software. In porous materials, the acoustic wave travels through a complex arrangement of small interconnected pores. Since the pores are small, losses usually arise due to heat conduction and friction. Porous foams are used in the soundproofing of rooms and ducts and to mitigate reverberation problems in closed spaces. This model aims to distinguish the absorption properties, specifically the surface impedance and the absorption coefficient of a layer of acoustic foam in terms of frequency. A 2D model is employed to simulate the porous material's absorption behavior over a wide range of frequency bands.
Figure 3 depicts the schematic and simulation results for the measurement of the absorption coefficient. It is shown that an incident sound wave strikes the porous MF's surface at an angle of 90 degrees. Only a small portion of domain width is modeled, and the periodic Floquet conditions are applied on the left and right boundary to extend the domain to infinity. A plane wave radiation condition is applied at the top of the domain. MF is modeled as a rigid porous elastic material, and the material parameters used in the simulation model are listed in Table 1. A rigid surface is used at the bottom to eliminate further transmission of the incident wave. The surrounding fluid domain consists of air. Sound waves are traveling from top to bottom, and subsequent acoustic energy suppressions are encountered in MF (Figure 4).
| Quantity | Unit | Value |
|---|---|---|
| Porosity | - | 0.995 |
| Flow resistivity | Pa·s/m2 | 10,500 |
| The viscous characteristic length parameters | - | 0.49 |
| Thermal characteristic length | μm | 470 |
| Viscous characteristic length | μm | 240 |
| Tortuosity factor | - | 1.0059 |
Table 1: Melamine material parameters for absorption coefficient computation.

Figure 3: (a) Schematics for absorption coefficient, (b) numerical simulation results for absorption coefficient.

Figure 4: (a) Schematics for transmission loss, (b) numerical simulation results for transmission loss.
Transmission loss: The Poro-elastic waves interface method is utilized to compute the transmission losses. The Poro-elastic wave model describes as the small deformation elastic waves propagating in a porous material coupled to waves in a fluid. The model accounts for the coupled displacement of the fluid/structure, making it a fluid-structure interaction problem. The 2D axisymmetric geometry is shown in Figure 5. The central portion contains MF, acting as acoustic insulation material and air in the rest of the system. The porous material is assumed to be isotropic with parameters as listed in Table 2. The acoustic pressure level throughout the domain is also shown in Figure 4. A sound wave traveling from bottom to top and subsequent acoustic energy suppression is encountered in MF.

Figure 5: Testing samples of melamine foam (100 mm & 30 mm diameters).
| Quantity | Unit | Value |
|---|---|---|
| Density | kg/m3 | 9 |
| Young’s modulus | kPa | 180 |
| Poisson’s ratio | - | 0.46 |
| Biot-Willis coefficient | - | 1 |
| Porosity | - | 0.995 |
| Permeability of porous matrix | m2 | 1.50E-09 |
Table 2: Melamine material parameters for transmission loss computation.
Experimental Setup
Introduction
VA-Lab2 IMP is the software code used for the computation of absorption coefficient and transmission loss. The hardware comprises impedance tube setup and data acquisition system. The Transfer function method uses a set of two microphones to acquire pressure level by a sound generating source near the sample. VA-Lab IMP can accurately separate the incident wave from the reflecting wave to measure the absorption coefficient. An extended frequency range can be obtained from the combination of measurement results gained from different diameters' tubes. VALab2 IMP supports the 2-channel hardware to measure absorption coefficient, and VA-Lab4 IMP supports four microphone transfer function methods to measure transmission loss [37].
Sample type
MF is selected porous material for this study of sound attenuation. It is an open-cell foam made from melamine resin which is a thermoset polymer. This foam comprises three-dimensional network structures consisting of slender and easily shaped filaments. Key characteristics of this foam are: -
• Low density and high acoustic absorption capacity
• Good heat insulation properties
• Can withstand temperature up to 240oC
Testing setup
The setup of the absorption coefficient testing system is shown in Figure 6. To measure the absorption coefficient of the material, the Source tube and Sample holder are necessary. The sound will be generated via a loudspeaker located at the extreme left side, and the sample holder is located at the extreme right of the tube. Two microphones are used to capture the sound energy level before and after absorption. Data acquisition board & a Lab VIEW system are used to gather and process the data. Microphones are positioned to capture all the frequency ranges of interest (64 Hz to 6.3 kHz).

Figure 6: Complete experimental setup for the measurement of the absorption coefficient.
Setup for measurement of transmission loss is shown in Figure 7. The sample holder is replaced by an extension tube to measure transmission loss. The sound will be generated via loudspeaker from the extreme left position; the extension tube is attached with the source tube at the extreme right, and a sample is placed between the source tube and extension tube. Two microphones are positioned on the upstream, and two are placed on the downstream region. Four microphones are used to measure the sound energy level before and after transmission. Data acquisition system processes these energy levels and provides the transmission loss. Microphones are positioned to capture the desired range of frequencies from 64 Hz to 6.3 kHz. For both absorption coefficient and transmission loss, the parameters, including tube diameter, the distance between two microphones, and the distance from the sample to the nearest microphone, decide the working frequency range. The data out of this pre-defined range of frequency will be inaccurate. The environmental conditions such as atmospheric pressure, temperature, humidity, velocity, and characteristic impedance should be accurately defined.

Figure 7: Complete experimental setup for the measurement of transmission loss.
As per testing standard, the loudspeaker should work at least 10 minutes before testing. The different positions of microphones work in the different effectual frequency range; curves out of the range will be random. For both types of testing, the test sample shall fit snugly in the holder. However, it shall not be compressed unduly nor fitted so tightly that it bulges. It is recommended to fill in the interspaces by using Vaseline or Plasticine between the sample and the tube. The test sample can be held firmly, if necessary, by adhesive tape or grease. For example, samples such as carpet material should be firmly attached to the backplate using double-sided adhesive tape to avoid vibration and unwanted air gaps. Most of the specimens, even the uniform ones, should be tested repeatedly. The same sample's absorption coefficient in different diameter tubes will be dissimilar mostly because of the dimension of the specimens and the situation of specimens' edge. Uncertainties to the determined acoustic material properties would come from material samples and placement, bias errors, and reference plane definition.
Results and Discussion
Absorption coefficient
The three samples' absorption coefficients (25 mm, 50 mm, and 75 mm) are measured using both the small and large tubes as shown in Figures 8 - 12 for working frequency range of 64 Hz to 6.3 kHz. This range is achieved with three arrangements. The first is from 63 Hz to 500 Hz with wide spacing of microphones. The second is from 400 Hz to 1600 Hz with normal spacing. The third arrangement is from 1600 Hz to 6.3 kHz with a small diameter tube and normal spacing of microphones. The flow resistance of the material under test is relatively low, and because the sample is effectively anechoically-terminated, most of the incident energy is either transmitted through the sample or is dissipated within it. As a result, the reflection's magnitude is relatively low, consequently having a higher absorption coefficient except at the lower frequencies where the edge constraint's effect stiffens the sample. It may be seen, as expected, that the absorption coefficients are nearly unity, except at the lower frequencies. Note also that there are resonance features at two different locations of all three samples. This behavior is typical of the effect of sample edge constraint on the normal incidence absorption loss of an elastic porous material [38]. The two features represent the effects of the first two diaphragm-like modes of the samples in which the sample experiences a pure shearing motion. The frequencies at which these features occur are inversely proportional to the sample diameter and are directly proportional to the square root of the ratio of the shear modulus and density of the sample. Thus, the first resonance in the large tube case occurs at approximately one-quarter of the small tube's resonance frequency. A similar relation exists in the difference in the impedance tube's diameter (100 mm & 30 mm). These features are not visible in FEA results because the acoustic analysis is performed on an infinite plate sheet where the sample edge constraint effect does not exist. Different thickness samples are shown in Figure 11. It can be observed that the absorption coefficient is increasing with the frequency, and a maximum value of 0.8 is achieved at 4,200 Hz for 25 mm thickness. Saturation in absorption coefficient is reached much earlier for higher thickness samples.

Figure 8: Absorption coefficient for 25 mm thick melamine foam.

Figure 9: Absorption coefficient for 50 mm thick melamine foam.

Figure 10: Absorption coefficient for 75 mm thick melamine foam.

Figure 11: Combined absorption coefficient plot for three thicknesses (Experimental).

Figure 12: Result comparison for absorption coefficient with published research.
These results are compared with other published research, as shown in Figure 12. Doutres et al. used a similar setup and found out acoustic properties of a porous material. The trend and magnitude of the absorption coefficient are similar to the present research. The absorption coefficient's saturation at the value of 1.0 is achieved at almost the same frequency resulting that the properties of the material are almost similar to the MF. However, the slight variation could be because of variation in thickness and change of test samples' material properties. Furthermore, in published research, the resonance features are not evident, highlighted in the present study. The prior information of these features can be beneficial for design and to avoid any possible failure at these critical frequencies.
Another researcher, Hughes et al. from NASA, carried out similar research on various test samples, including 2 in MF for absorption coefficient only. However, the boundary conditions were different. They used a flat panel rather than a cylindrical tube type boundary condition. They used a higher quality of MF, thus, having better material properties. The active frequency range is the same, which suggests that both materials tend to attenuate the sound wave for a wide frequency range.
Transmission loss
The transmission loss of all three samples (25 mm, 50 mm, and 75 mm) is estimated first through FEA and later validated with both large and small diameter impedance tubes as shown in Figures 13 - 16. It is shown that the transmission loss increases monotonically with increasing frequency as expected for a porous layer. The working frequency range is from 64 Hz to 6.3 kHz. Note also that resonance features at approximately 450 Hz, and 1800 Hz appear in the large and small tube results. This behaviour is typical of the effect of sample edge constraint on the normal incidence transmission loss of an elastic porous material. Similar features are observed in the measured absorption coefficient. Thus, the first resonance in the large tube case occurs at approximately onequarter of the small tube's resonance frequency. A similar relation exists in the difference of impedance tube diameters (100 mm & 30 mm). These features are not visible in FEA results because the acoustic analysis is performed on an infinite plate sheet where the sample edge constraint effect does not exist. Nonetheless, a close examination of the data shows that the transmission loss does increase with decreasing frequency below the first resonance in both the large and small tube results. Thus, at low frequencies, the sample edge constraint causes the normal incidence transmission loss of a porous sample measured in a tube to differ from that of a laterally infinite plane sheet of the same material as depicts in FEA results. This effect becomes more significant as the flow resistivity of the samples increases (therein increasing the strength of the coupling between the solid and fluid phases of the material), and the shear stiffness of the sample increases in proportion to its bulk density (increasing the frequency of the diaphragm-like resonances).

Figure 13: Transmission loss for 25 mm thick melamine foam.

Figure 14: Transmission loss for 50 mm thick melamine foam.

Figure 15: Transmission loss for 75 mm thick melamine foam.

Figure 16: Combined transmission loss plot for three thicknesses (Experimental).
Figures 13(a) - 15(a) show that the analytical results obtained via commercial FEA software and experimental results are in good agreement. It is observed that the trend of both approaches is the same. However, there is a larger variation in analytical results around the experimental value. Therefore, a mean window operation is applied to the data. In this approach, the mean of five consecutive values is computed and plotted against the mean frequency. Additional processing in the analytical data is performed with the assumption that the data acquired from the experimental setup is being processed. Figures 13(b) - 15(b) shows the linear fit plot for both analytical and experimental results. These plots follow each other and are in good agreement.
The combined transmission loss plot for three different thickness samples is shown in Figure 16. It is observed that the transmission losses are increasing with the frequency except for ~ 450 Hz & ~1,800 Hz, where a resonance effect is evident. Furthermore, an appreciable increase in transmission losses is observed with the increasing foam thickness. Similar to absorption coefficient, the results of transmission loss are compared with other published research, as shown in Figure 17. Doutres et al. used a similar setup and found out acoustic properties of a porous material. The trend and magnitude of transmission loss are similar to the present research. Like the absorption coefficient, the magnitude of transmission loss is higher than 50 mm MF because of its higher thickness and better physical properties. In published research, the resonance features are similar to present research at displaced frequencies. Another researcher, Hughes et al. from NASA, carried out similar research on various test samples for transmission loss. However, the sample configuration was different from the present research.

Figure 17: Results comparison for transmission loss with other published research.
Conclusion
The acoustic parameters, including transmission loss and absorption coefficient, are investigated both numerically and experimentally with a working frequency range of 64 Hz to 6.2 kHz using melamine foam (MF). Three different sample thicknesses are employed to correlate better the acoustic parameters concerning frequency and thickness. The resonance features are identified in both absorption coefficient and transmission loss measurements. The saturation level for absorption coefficients is achieved earlier for higher thickness compared to the lower thickness of MF lining. The transmission loss of 2-4 dB (25 mm), 4-6 dB (50 mm), and 6-8 dB (75 mm) is achieved for variable thickness samples. Numerically computed parameters are validated using impedance tube setup and are found in good agreement. These results are very useful to estimate the acoustic characteristics for designing insulation blanket of different structure which are vulnerable against acoustic loading.
REFERENCES
- Do T. Vibroacoustic Modeling Study of the Delta II 10-Foot Composite Fairing. Journal of the IEST 1999;42(6):26-33.
- Defosse H, Hamdi MA. Vibro-acoustic study of Ariane V launcher during lift-off. The 29th International exhibition on noise control engineering, France. 2000.
- Bianco D, Francesco P, Barbarin M, Vitiello P, Bartoccini D, Federico L, et al. Integrated Aero–Vibroacoustic: The Design Verification Process of Vega-C Launcher. Appl Sci 2018; 8:88.
- Scott JM, Jay BG, Robert CB. General Environmental specification for STS and ELV – Payloads, Subsystems, and Components. GEVS-SE. Rev. June, NASA Goddard Space Flight Center.
- Glaese RM, Anderson EH. Initial structural-acoustic modeling and control results for a full-scale composite payload fairing for acoustic launch load alleviation. CSA Engineering, 1999.
- Yuan GH, Wang XC, Hou PZ, LI CL. Absorbing property of open-cell melamine foam. Material Mechanical Engineering 2007;31(9):55–57.
- Arenas JP, Crocker MJ. Recent trends in porous sound absorbing materials. Sound & Vibration 2010;44 (7):12–17.
- McNelis AM, Hughes WO, McNelis ME. NASA Engineering and Safety Center (NESC) Enhanced Melamine (ML) Foam Acoustic Test (NEMFAT). NASA, 2014.
- McNelis AM, Hughes WO. Effect of Coversheet Materials on the Acoustic Performance of Melamine Foam. NASA Glenn Research Center at Lewis Field, 2015.
- McNelis AM, Hughes WO, McNelis ME. Acoustic Test Characterization of Melamine Foam for Usage in NASA's Payload Fairing Acoustic Attenuation Systems. Glenn Research Center, 2014.
- Li B, Chen X, Yan W, Yan S, He X. Theoretical and Experimental Study on Effect of Melamine Foam Lining on Acoustic Characteristics of a Cylindrical Cavity. Results in Physics. 2019;13.
- Bolton JS. Porous materials for sound absorption and transmission control 2005. Porous Materials for Sound Absorption and Transmission Control. Proceedings of Congress and Exposition on Noise Control Engineering.
- Doutres O, Salissou Y, Atalla N, Panneton R. Evaluation of the acoustic and non-acoustic properties of sound absorbing materials using a three-microphone impedance tube. Appl Acoust 2010; 71(6):506-509.
- Wijntjes R, Simon F, Haase T, Unruh O, Tijs E. Benchmark for Experimentation of Acoustic Transmission Loss Applied to Helicopter Trim Panels 2016.
- Deaconu M, Cristea L. Sound Transmission Loss in Porous and Isotropic Materials. Comparative Analysis Between Impedance Tube and FEM Results. Proceedings of the Annual Symposium of the Institute of Solid Mechanics and Session of the Commission of Acoustics, SISOM 2016 Bucharest 2016;12-13.
- Salissou Y, Panneton R. A general wave decomposition formula for the measurement of normal incidence sound transmission loss in impedance tube. J. Acoust. Soc Am 2083-2009; 125(4).
- Kundu A, Berry A. Active sound control with smart foams using piezoelectric sensoriactuator. J Intell Mater Syst Struct 2011;22 (16):1771-1787.
- Doutres O, Atalla N. Experimental estimation of the transmission loss contributions of a sound package placed in a double wall structure. Appl Acoust 2011;22(6):372-379.
- Lauriks W, Boeckx L, Leclaire P. Characterization of porous acoustic materials. Symposium on the Acoustics of Poro-Elastic Materials.
- Ji G, Fang Y, Zhou J, Huang X. Porous labyrinthine acoustic metamaterials with high transmission loss property. J Appl Phys. 2019; 125:21.
- Yang Y, Chen Z, Tengzhou X, Han R, Awuye DE. Sound insulation and hydrophobic properties of phenolic resin modified melamine foam: Role of micro-morphology. Materials Research Express, 2019.
- COMSOL Multiphysics modeling Guide.
- Allam S, Knutsson M, Boden H. Development of Acoustic Models for High Frequency Resonators for Turbocharged IC-Engines. MS thesis in Sound & Vibration Stockholm, 2011.
- Strek T. Finite Element Modeling of Sound Transmission Loss in Reflective Pipe. Poznan University of Technology Institute of Applied Mechanics 2010.
- Nakagawa H, Hirosawa K. Development of a narrow impedance tube to measure normal absorption coefficient and transmission loss at high frequencies around 10 kHz. Acoustic Science & Technology 2018.;39(6).
- Bolton JS, Yoo T, Olivieri O. Measurement of Normal Incidence Transmission Loss and Other Acoustical Properties of Materials Placed in a Standing Wave Tube. Technical Review, Brüel& Kjær Sound & Vibration Measurement A/S, 2007.
- Hua X, Herrin DW. Practical considerations when using the two-load method to determine the transmission loss of mufflers and silencers. SAE International Journal of Passenger Cars – Mechanical System 2013;6(2).
- Oblak M, Pirnat M, Boltežar M. An impedance tube submerged in a liquid for the low-frequency transmission-loss measurement of a porous material. Appl Acoust 2018;139: 203-212.
- Yousefzadeh B, Mahjoob M, Mohammadi N, Shahsavari A. An experimental study of sound transmission loss (STL) measurement techniques using an impedance tube. J Acoust Soc Am. 2008;123,
- Wolkesson M. Evaluation of impedance tube methods a two microphone in-situ method for road surfaces and the three microphone transfer function method for porous materials. Department of Civil and Environmental Engineering Division of Applied Acoustics, 2012.
- Seybert AF, Ross DF. Experimental determination of acoustic properties using a two-microphone random-excitation technique. J Acoust Soc Am 1997;61(5):1362-1370.
- ISO 10534-2. Acoustics – determination of sound absorption coefficient and impedance in impedance tubes – part 2: transfer-function method, ISO 10534-2,1998.
- Bolton JS, Shiau NM, Kang YJ. Sound transmission through multi-panel structures lined with elastic porous materials. J Sound Vibration 1996;191(3):317–347.
- Ho KM, Yang Z, Zhang XX, Sheng P. Measurements of sound transmission through panels of locally resonant materials between impedance tubes. Appl. Acoust. 2005;66: 751–765.
- Ryu Y. The acoustic impedance measurement system using two microphones, Bruel & Kjaer sound & vibration measurement a/s, Denmark, 2000.
- Jung SS, Kim YT, Lee YB, Cho SI, Lee JK. Measurement of sound transmission loss by using impedance tubes. J Korean Phys Soc 53;2: 596-600, 2008.
- User's Manual Impedance Tube Test System No: BSWA-III-C021-03-0027-IMP Ver.: V1.03 Release Date: Mar./09/2010 BSWA TECH.
- Beranek LL. Some notes on the measurement of acoustic impedance. J Acoust Soc Am. 1947;19: 420-427.
Citation: Zai BA, Sami S, Ali R (2021) Determination of Acoustic Characteristics of Melamine foam with Experimental Validation. J Appl Mech Eng. 10: 366.
Copyright: © 2021 Zai BA, et al. This is an open access article distributed under the term of the Creative Commons Attribution License, which permits unrestricted use, distribution, and reproduction in any medium, provided the original author and source are credited.