Indexed In
- Open J Gate
- Genamics JournalSeek
- Academic Keys
- ResearchBible
- Cosmos IF
- Access to Global Online Research in Agriculture (AGORA)
- Electronic Journals Library
- RefSeek
- Directory of Research Journal Indexing (DRJI)
- Hamdard University
- EBSCO A-Z
- OCLC- WorldCat
- Scholarsteer
- SWB online catalog
- Virtual Library of Biology (vifabio)
- Publons
- Geneva Foundation for Medical Education and Research
- Euro Pub
- Google Scholar
Useful Links
Share This Page
Journal Flyer

Open Access Journals
- Agri and Aquaculture
- Biochemistry
- Bioinformatics & Systems Biology
- Business & Management
- Chemistry
- Clinical Sciences
- Engineering
- Food & Nutrition
- General Science
- Genetics & Molecular Biology
- Immunology & Microbiology
- Medical Sciences
- Neuroscience & Psychology
- Nursing & Health Care
- Pharmaceutical Sciences
Research Article - (2019) Volume 8, Issue 2
Comparison of Univariate and Multivariate Models to Analyze Stability of Common Bean (Phaseolus vulgaris L.) Genotypes in Ethiopia
Demelash Bassa1*, Fekadu Gurmu2 and Hussein Mohammed32Hawassa Agricultural Research Center, Hawassa, Ethiopia
3School of Plant and Horticultural Science, College of Agriculture, Hawassa University, Hawassa, Ethiopia
Received: 11-Jan-2019 Published: 18-Mar-2019, DOI: 10.35248/2168-9881.19.8.188
Abstract
Data of sixteen Andean red common bean genotypes were evaluated across six environments using seven univariate and two multivariate models to study Genotype by Environment Interaction (GEI) and stability in Ethiopia. There was significant (P<0.01) genotype, environment and GEI that necessitated estimation of the stability of the genotypes. According to the multivariate analysis of Additive Main Effects and Multiplicative (AMMI), Red kidney, DAB 478 and Melkadima were stable. According to Genotype plus Genotype by Environment (GGE) interaction bi-plot analysis, DAB 544, Red kidney, DAB 478, DAB 532 and DAB 478 were found stable. The univariate models identified stable genotypes DAB 478 and DAB 544 in common whereas the multivariate models AMMI and GGE identified best performing and stable genotypes Red kidney and DAB 478 across the six test environments. Therefore, one of the five univariate models except Lin and Binn’s cultivar performance measure and coefficient of determination and one of the two multivariate models can be used for stability study of common bean in Ethiopia.
Keywords
Common bean; GEI; Multivariate; Stability; Univariate
Introduction
Common bean (Phaseolus vulgaris L., 2n=22) ranks third next to sesame and chickpea as an export commodity in Ethiopia, contributing for about 9.5% of total export value from agriculture [1]. It is source of proteins, minerals and vitamins for poor farmers [2], provides fodder for feeding livestock and contributes to soil fertility improvement through atmospheric nitrogen fixation during the cropping season [3,4]. Common bean is mainly grown in eastern, southern, south western and the central Rift valley areas of Ethiopia [5].
Genotype by environment interaction (GEI) is an important issue in improvement that affects the consistence performance of genotypes across environments. The stability of genotypes can be estimated by different univariate and multivariate statistical parameters as suggested by different authors [6-8].
Wricke [9] suggested that the contribution of each genotype to GEI sum of squares as ecovalence (Wi) and genotypes with the least/ zero ecovalence are considered as stable [6]. According to Finlay and Wilkinson [10], a genotype is stable when regression coefficient is unity and with high mean yield. Eberhart and Russell [11] stated that a genotype is said to be stable when regression coefficient is one, mean yield greater than grand mean and deviation from regression is zero. A genotype is stable when high value of coefficient of determination is recorded in genotype ranking according to Pinthus [12]. According to Shukla [13], a genotype is stable when Shukla stability variance is equal to environmental variance i.e. Shukla stability variance is zero [14].
The Lin and Binn’s [15] cultivar performance measure (Pi) defines a stable genotype as a genotype with the lowest value of cultivar performance measure. Additive Main Effects and Multiplicative Interaction (AMMI) analysis interprets the effect of genotype (G) and environment (E) as additive effects plus GEI as multiplicative component and genotype stability is estimated based on Principal Component Analysis (PCA) [16]. According to Purchase [17] a stable genotype is a genotype with the least AMMI Stability Value (ASV), because the lower the ASV of the genotype, the lower the contribution of a genotype to genotype by environment interaction. Although Mesoamerican common bean types have been fairly studied in both regional and national research system of the country, little has been studied and recorded in comparison of univariate and multivariate models to analyze stability of Andean gene pool particularly, the Andean red common beans. Therefore, the current study was conducted with the objective of comparing univariate and multivariate models for analyzing GEI and stability of Andean red common bean genotypes in Ethiopia.
Materials and Methods
Description of experiment sites and plant materials
The experiment was carried out in 2017 cropping season in six environments, namely, Alem Tena, Areka, Arsi Negele, Gofa, Kokate and Melkassa (Table 1). Sixteen Andean red common bean genotypes (14 advanced lines and 2 released varieties) obtained from Ethiopian Institute of Agricultural Research (EIAR), Melkassa Agricultural Research Center were used for this experiment (Table 2).
Table 1: Description of the study sites.
| Trial site | Altitude (masl) | Annual RF (mm) | Mean T°(°C) | Soil type | Global position | ||
|---|---|---|---|---|---|---|---|
| Max. | Mini. | Latitude(N) | Longitude(E) | ||||
| Alem Tena | 1610 | 728 | 29.8 | 12.9 | Andosols | 8°30'06'' | 38°95'12'' |
| Areka | 1780 | 1438 | 26.2 | 14.2 | Alisols | 7°06'97'' | 37°69'72'' |
| Arsi Negele | 1960 | 807 | 23.3 | 13.8 | Nitosols | 7°36'11'' | 38°66'87'' |
| Gofa | 1297 | 1338 | 29.4 | 17.6 | Acrisols | 6°36'09'' | 37°12'59'' |
| Kokate | 2156 | 655 | 24.2 | 13.6 | clay loam | 6°85'28'' | 37°76'10'' |
| Melkassa | 1550 | 763 | 33.2 | 14.2 | Andosols | 8°52'63'' | 39°25'33'' |
masl=meters above sea level, RF=Rain fall, T°(°C)=Temperature in degree centigrade, mm=millimeter
(Source: Adapted from Areka and Melkassa Research centers and Hawassa Regional Meteorology Agency)
Table 2: Description of the Andean red common bean genotypes used for the experiment.
| No. | Genotype name | Status | Year of release |
|---|---|---|---|
| 1 | DAB 317 | Under NVT | Not yet released |
| 2 | DAB 496 | Under NVT | Not yet released |
| 3 | DAB 513 | Under NVT | Not yet released |
| 4 | DAB 481 | Under NVT | Not yet released |
| 5 | DAB 540 | Under NVT | Not yet released |
| 6 | DAB 512 | Under NVT | Not yet released |
| 7 | DAB 525 | Under NVT | Not yet released |
| 8 | DAB 478 | Under NVT | Not yet released |
| 9 | DAB 482 | Under NVT | Not yet released |
| 10 | DAB 523 | Under NVT | Not yet released |
| 11 | DAB 497 | Under NVT | Not yet released |
| 12 | DAB 532 | Under NVT | Not yet released |
| 13 | DAB 544 | Under NVT | Not yet released |
| 14 | DAB 545 | Under NVT | Not yet released |
| 15 | Melkadima (check) | Released | 2006 |
| 16 | Red kidney (check) | Released | 2007 |
NVT=National Variety Trials
Experimental design and cultural practices
The experiment was laid down using triple lattice design at six environments. The experimental plot length, width, gross plot size and net plot size was 2.4 m, 4 m, 9.6 m2 and 6.4 m2 respectively. The spacing between plots, blocks and replications was 50,100 and 150 cm respectively. The seeds were sown with the spacing of 40cm between rows and 10 cm between seeds with 100-110 kg ha-1. Fertilizer was used at the rate of 122 kg ha-1 NPSB (18.9N-37.7P2O5- 6.95S-0.1B).
Data collection and analysis
Data collection: Seed yield and yield related data were collected, however, seed yield was considered in the analysis. Seed yield was harvested and threshed from the net plot area; the seed obtained from each plot was weighed in gram plot-1and converted into ton ha-1 and finally adjusted to standard moisture level (12.5%).
Data analysis: The seed yield data was analyzed using ANOVA and stability parameters after testing the homogeneity of error variance across test environments by using SAS software version 9.0 and Gen Stat 17th version [18] statistical software. The univariate and multivariate stability parameters were analyzed using stability SAS syntax developed by Hussein et al. [8]. The univariate and the multivariate stability parameters used for estimation of seed yield stability include Wricke [9] ecovalence (Wi), Finlay and Wilkinson’s [10], Eberhart and Russell [11], Pinthus [12], Shukla [13], Lin and Binn’s [15] cultivar performance measure (Pi), Purchase’s [17] AMMI Stability Value (ASV), Additive Main Effects and Multiplicative Interaction (AMMI) [19] and genotype plus genotype by environment interaction (GGE) [20,21].
Results
ANOVA of common bean genotypes
There was a highly significant difference (P<0.01) among genotypes tested at six environments (Table 3).
Table 3: Combined ANOVA for seed yield of common bean genotypes (ton ha-1).
| Source of variation | Degree of Freedom | Sum of Square | Mean Square | Fcal | Pr>F |
|---|---|---|---|---|---|
| Env | 5 | 246.07 | 49.21 | 382.38 | <.0001 |
| Gen | 15 | 11.76 | 0.78 | 6.09 | <.0001 |
| Block(Env) | 12 | 2.16 | 0.18 | 1.40 | 0.016 |
| GenEnv | 75 | 36.82 | 0.49 | 3.81 | <.0001 |
| Error | 180 | 23.16 | 0.13 | ||
| Total | 287 | 319.98 |
CV= 16.9%
R-Square= 0.96
Grand Mean= 2.19
Stability and correlation analyses
The most stable genotypes according to Wricke [9] were DAB 478 and DAB 544 with the mean seed yield rank order of 7th and 8th respectively whereas genotypes showing instability were DAB 512, DAB 540, DAB 482, DAB 525, DAB 513 and DAB 497 with the mean seed yield rank order of 5th, 14th, 2nd, 16th and 9th respectively (Table 4). Previous studies identified stable and unstable genotypes using Wricke’s [9] ecovalence for different crops in different environments, for example, common bean [22] and maize [23,24]. Genotype DAB 478 and DAB 544 were also stable based on Shukla [13] stability method and the unstable genotypes were DAB 497, DAB 513 and DAB 525 with the mean seed yield rank order of 14th, 16th and 3rd respectively (Table 4). Previous findings in different crops in different environments by using Shukla [13] were reported on winter wheat [17], on bread wheat [14] and on common bean [22]. According to ASV of Purchase [17], stable genotypes were Red kidney, DAB 478, DAB 544, Melkadima, DAB 532 and DAB 481whereas unstable genotypes were DAB 497, DAB 513, DAB 525, DAB 512 and DAB 482 (Table 5). This finding was supported by different studies on GEI and stability of different crops, for example, Abel [25], Afework [26] and Kanko [27] on common bean, coffee and potato crops respectively. According to Finlay and Wilkinson’s [10], genotypes DAB 544, Melkadima and Red kidney showed average stability. The identification of stable genotypes using Finlay and Wilkinson’s graph representation on different crops at different locations was reported by Goa [28] on field pea and Samuel [29] on pigeon pea. Genotypes DAB 478, DAB 523, DAB 544 and Melkadima were stable based on Eberhart and Russell [11] analysis. According to Lin and Binn’s [15], genotypes Melkadima and DAB 512 were stable whereas genotypes DAB 513, DAB 497 and DAB 496 were unstable (Table 4). In the current study, coefficient of determination indicated 74% to 99.5% of the difference between genotype in the mean seed yield was explained by genotype response across six testing environments and the fitness of the model in the study since its value was between zero and one (Table 4). The coefficient of determination result differs from the analysis result of Mekbib and Kefelegn [22] in GEI and stability study of common bean in Eastern Amhara Region of Ethiopia.
Table 4: Comparison of stability models for used for GEI and stability analysis of seed yield of 16 Andean red common bean genotypes tested in six environments.
| Gen. |  yield yield |
R | Wi | R | δi2 | R | ASV | R | S2di | R | Bi | R | Pi | R | r2 | R |
|---|---|---|---|---|---|---|---|---|---|---|---|---|---|---|---|---|
| a | 2.138 | 10 | 0.0144 | 5 | 0.025 | 5 | 0.64815 | 9 | -0.005 | 4 | 1.139 | 13 | 0.260 | 9 | 0.991 | 2 |
| b | 1.932 | 15 | 0.0177 | 7 | 0.033 | 7 | 0.78778 | 10 | -0.007 | 3 | 0.834 | 3 | 0.509 | 14 | 0.985 | 4 |
| c | 1.842 | 16 | 0.1588 | 15 | 0.380 | 15 | 2.35839 | 15 | 0.064 | 10 | 0.473 | 2 | 0.791 | 16 | 0.767 | 15 |
| d | 2.090 | 11 | 0.0338 | 9 | 0.073 | 9 | 0.27139 | 6 | 0.071 | 11 | 0.988 | 7 | 0.374 | 12 | 0.930 | 11 |
| e | 2.005 | 13 | 0.1040 | 12 | 0.245 | 12 | 1.0467 | 11 | 0.258 | 16 | 0.967 | 5 | 0.444 | 13 | 0.806 | 14 |
| f | 2.461 | 2 | 0.0939 | 11 | 0.220 | 11 | 1.80998 | 13 | 0.085 | 12 | 1.345 | 14 | 0.094 | 1 | 0.955 | 9 |
| g | 2.449 | 3 | 0.1456 | 14 | 0.347 | 14 | 2.27882 | 14 | 0.171 | 15 | 1.403 | 16 | 0.135 | 3 | 0.927 | 12 |
| h | 2.267 | 7 | 0.0033 | 1 | -0.002 | 1 | 0.13162 | 2 | -0.013 | 1 | 1.038 | 10 | 0.194 | 5 | 0.995 | 1 |
| i | 2.359 | 5 | 0.1110 | 13 | 0.263 | 13 | 1.42109 | 12 | 0.124 | 14 | 1.354 | 15 | 0.209 | 7 | 0.940 | 10 |
| j | 2.316 | 6 | 0.0103 | 3 | 0.015 | 3 | 0.43148 | 8 | 0.006 | 5 | 0.967 | 6 | 0.197 | 6 | 0.978 | 5 |
| k | 1.940 | 9 | 0.2079 | 16 | 0.501 | 16 | 2.77583 | 16 | 0.037 | 9 | 0.362 | 1 | 0.762 | 15 | 0.740 | 16 |
| l | 2.055 | 12 | 0.0133 | 4 | 0.023 | 4 | 0.26694 | 5 | 0.016 | 7 | 0.996 | 8 | 0.373 | 11 | 0.971 | 7 |
| m | 2.222 | 8 | 0.0057 | 2 | 0.004 | 2 | 0.22432 | 3 | -0.007 | 2 | 0.957 | 4 | 0.231 | 8 | 0.989 | 3 |
| n | 2.385 | 4 | 0.0461 | 10 | 0.103 | 10 | 0.39262 | 7 | 0.098 | 13 | 1.069 | 11 | 0.176 | 4 | 0.923 | 13 |
| o | 2.462 | 1 | 0.0155 | 6 | 0.028 | 6 | 0.26502 | 4 | 0.015 | 6 | 1.075 | 12 | 0.099 | 2 | 0.976 | 6 |
| p | 2.177 | 9 | 0.0187 | 8 | 0.036 | 8 | 0.04058 | 1 | 0.029 | 8 | 1.033 | 9 | 0.271 | 10 | 0.964 | 8 |
 yield: mean yield in ton ha-1,
a=DAB 317, b=DAB 496, c=DAB 513, d=DAB 481, e=DAB 540, f=DAB 512, g=DAB 525, h=DAB 478, i= DAB 482, j=DAB 523, k=DAB 497, l=DAB
532, m=DAB 544, n=DAB 545, o=Melkadima (Ch.) and p=Red kidney (Ch.)
Gen: Genotypes; bi: Slope/Coefficient of Regression; r2: Coefficient of Determination; Wi: Wricke’s Ecovalence; δi2: Shukla’s Variance; ASV: AMMI:
Additive Main Effect and Multiplicative Interaction stability value.
Table 5: AMMI ANOVA for seed yield (ton ha-1) of common bean genotypes evaluated across six test environments.
| Source of Variation | Degree of Freedom | Sum of Square | Mean Square | %Sum of Square | %GEI |
|---|---|---|---|---|---|
| Genotypes | 15 | 11.15 | 0.74 | 3.80 | |
| Environments | 5 | 236.86 | 47.37 | 80.9 | |
| Block | 12 | 1.25 | 0.10ns | 0.50 | |
| GenEnv | 75 | 32.25 | 0.43 | 11.10 | |
| IPCA1 | 19 | 20.83 | 1.09 | 7.10 | 64.60 |
| IPCA2 | 17 | 6.76 | 0.39 | 2.40 | 21.00 |
| IPCA3 | 15 | 2.63 | 0.17 | 0.90 | 8.20 |
| IPCA4 | 13 | 1.84 | 0.14 | 0.70 | 5.80 |
| IPCA5 | 11 | 0.20 | 0.02 | 0.10 | 0.60 |
| Error | 180 | 11.43 | 0.06 | 3.90 | 0.20 |
| Total | 287 | 292.95 |
NB. IPCA1, IPCA2, IPCA3, IPCA4 and IPCA5 are Interaction Principal Component Axes 1, 2, 3, 4 and 5 respectively.
GEI=genotype by environment interaction.
The multivariate analysis AMMI [16] showed significant difference (P<0.01) for genotype, environment and GEI. The environment main effect showed the highest contribution (80.9%) followed by interaction (11.0%) and genotype (3.8%) from the total variation of seed yield across six test environments [Table 5]. Similar results were reported by different authors reported on common bean chickpea [30], Potato [27] and soya bean [31]. The genotypes near to the AMMI bi-plot origin viz. p (Red kidney), h (DAB 478) and o (Melkadima) were stable whereas those genotypes relatively far apart from the origin such as k (DAB 497), c (DAB 513), f (DAB 512), g (DAB 525), e (DAB 540) and i (DAB 48) were unstable (Figure 1). The identification of stable and unstable genotypes by using AMMI bi-plot was reported in different environment in different crops, for example, on common bean [25,32] and chickpea Legesse et al. [30]. The GGE bi-plot analysis identified the best performing genotype in each test environment [21]. Accordingly, genotypes such as i (DAB 482), n (DAB 545), h (DAB 478), o (Melkadima) and j (DAB 523) performed best at Alem Tena and Arsi Negele environments whereas genotypes c (DAB 513), b (DAB 496), m (DAB 544), p (Red kidney) and k (DAB 497)performed best at Areka, Gofa and Kokate environments. In addition, genotypes g (DAB 525), e (DAB 540), f (DAB 512) and a (DAB 317) can be produced at Melkassa environment. Genotypes that adapted to all test environments were m (DAB 544), p (Red kidney), h (DAB 478), l (DAB 532) and d (DAB 481). Three mega-environments were identified by GGE bi-plot analysis, viz. the most discriminating environments (Melkassa), moderately performing environments (Arsi Negele and Alem Tena) and the un-discriminating environments (Areka, Gofa and Kokate) (Figure 2). The Andean red common bean genotypes score and stability of genotypes across environments is displayed in Figure 3. Based on this, genotypes which had absolute shorter projection, G4 (DAB 481), G8 (DAB 478), G13 (DAB 544), G15 (Melkadima) and G16 (Red kidney) were stable across all environments. Previous findings have shown the classification of environments using GGE bi-plot analysis in different environments in different crops, for example, chickpea [30] and ground nut [33].
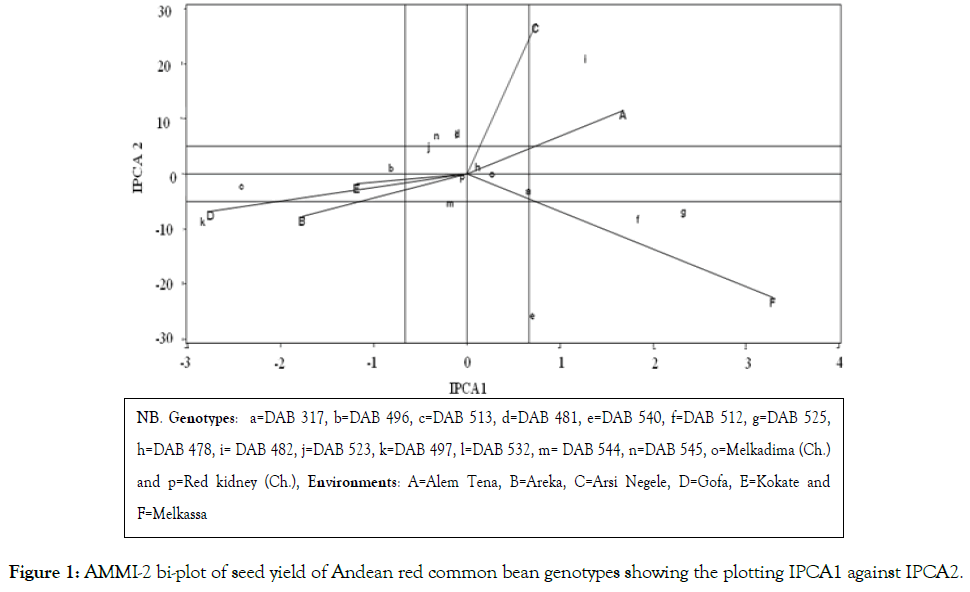
Figure 1: AMMI-2 bi-plot of seed yield of Andean red common bean genotypes showing the plotting IPCA1 against IPCA2.
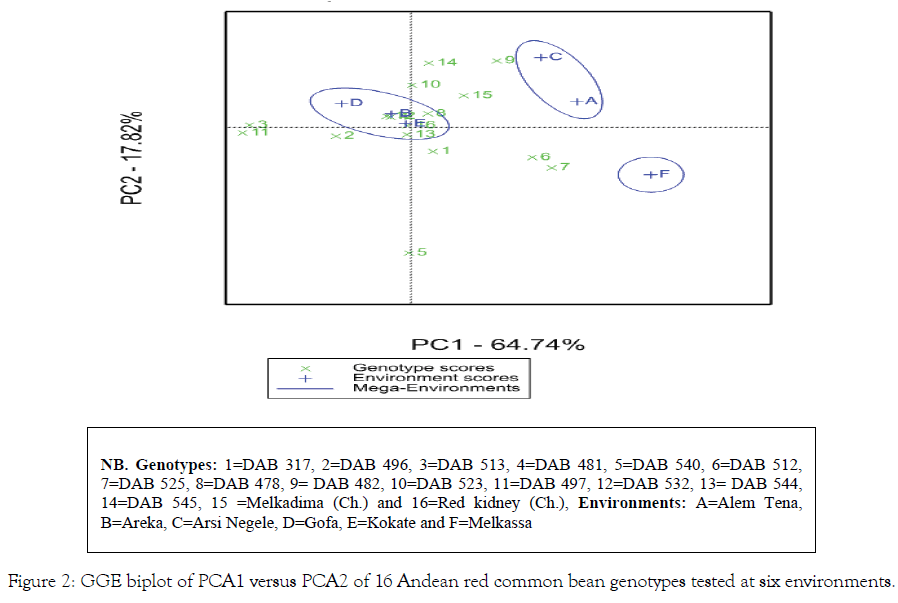
Figure 2: GGE biplot of PCA1 versus PCA2 of 16 Andean red common bean genotypes tested at six environments.
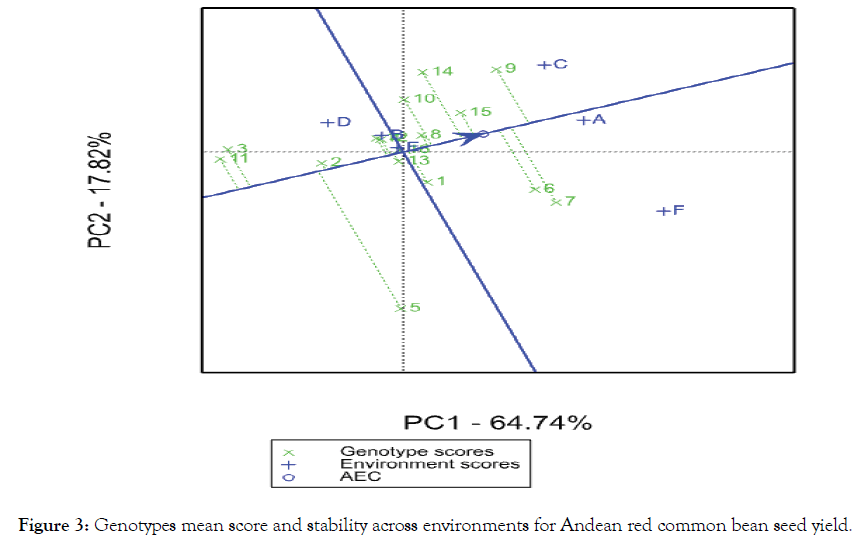
Figure 3: Genotypes mean score and stability across environments for Andean red common bean seed yield.
Different authors used Spearman's rank correlation coefficient to estimate the correlation of stability models on common bean (22,25), coffee [26] and maize [24]. Thus, Spearman’s rank correlation coefficient [34] was estimated for each of pair-wise comparison for the ranks of different univalent stability models used in the study (Table 6). The mean seed yield was found to be non-significantly correlated with Shukla’s stability variance (r=0.22), Wricke’s ecovalence (r=-0.22), deviation from regression (r=0.09) and AMMI stability value (ASV) (r= -0.19). This indicated that these stability estimating procedures provided information that cannot be gathered from estimating average seed yield alone [35]. The non-significant correlation of yield with these stability parameters was reported in bio-fortified common bean stability study [25]. In contrary, the result of rank correlation coefficient indicated that the mean seed yield had positive highly significant correlation with regression coefficient (bi) (r=0.80) and coefficient of determination (r=0.55) whereas it had negative highly significant correlation with Lin and Binn’s performance measure (Pi) (r=- 0.98). The significant negative correlation (r=-0.98) of seed yield with Pi indicated that the genotypes were highly responsive to the high yielding environments were less responsive to low yielding environments and vice versa [36]. The significant negative correlation of Lin and Binn’s performance measure with seed yield was reported by Issa [24].
Table 6: Spearman's rank correlation coefficient for the univariate stability models used in the study.
| Yield | ASV | S2di | δi2 | Wi | bi | Pi | ri2 | |
|---|---|---|---|---|---|---|---|---|
| Yield | 1.000 | |||||||
| ASV | -0.199 | 1.000 | ||||||
| S2di | 0.166 | 0.54 | 1.000 | |||||
| δi2 | -0.152 | 0.81 | 0.79 | 1.000 | ||||
| Wi | -0.152 | 0.81 | 0.79 | 1.00 | 1.000 | |||
| bi | 0.79 | -0.072 | 0.312 | -0.004 | -0.004 | 1.000 | ||
| Pi | -0.979 | 0.241 | -0.056 | 0.265 | 0.265 | -0.78 | 1.000 | |
| ri2 | 0.202 | -0.64 | -0.83 | -0.90 | -0.90 | 0.169 | -0.315 | 1.000 |
ASV: AMMI stability value; S2di: deviation from regression; δi2: Shukla’s stability Variance; Wi: Wricke’s ecovalence; bi: regression coefficient; Pi: Lin and Binn’s cultivar performance measure; ri2: coefficient of
determination.
The coefficient of determination (r2) had negative highly significant correlation (P<0.01) with ASV (r=-0.72), Shukla’s variance ([δi]^2) (r=-0.85), Wricke’s ecovalence (Wi) (r=-0.85) and Lin and Binn’s performance measure (Pi) (r=-0.78) but it had positive significant correlation with yield (r=0.55) and coefficient of regression (bi) (r= 0.66).
The Wricke’s ecovalence(Wi) had positive perfect correlation with Shukla’s variance (r=1) which showed that the two procedures ranked Andean red common bean genotypes similarly and hence either procedures can be used for ranking the genotypes.
The significant correlations of seed yield with these parameters were reported by Issa [24], Nigussie [22] and Purchase [17]. The ecovalence also had positive significant correlation with ASV (r=0.95) and deviation from regression (S2di) (r=0.55). The Lin and Binn’s cultivar performance measure (Pi) had negative highly significant (P<0.01) correlation with yiel d (r=-0.92) and coefficient of regression (bi) (r=-0.89) but it had no correlation with S2di (r=0.00). Generally, the perfect correlation of ecovalence with Shukla indicated the use of either procedure was sufficient. Similarly, the positive significant correlation among ASV, Shukla and ecovalence indicated that the use of one of stability parameters was also sufficient to study Andean red common bean genotypes stability. Spearman correlations in GEI and stability studies were reported in field pea [28] and in common bean [22,25].
Discussion
The presence of variability among seed yield showed that the genotypes performed differently across six locations. This was reported by various authors for legume crops Nigussie [22] and Yeyis et al. [37] for common bean and Fekadu [31], for soya bean. The presence of significant difference among genotypes, environments and environment by genotype interaction necessitated stability analyses that helped to identify either stable genotypes for wider adaptation or unstable genotypes for specific adaptation. Based on this, seven univariate and two multivariate stability models were compared to estimate the stability of seed yield tested across six locations. Different authors compared univariate and multivariate stability analysis models using Spearman’s rank correlation coefficient in maize [23], durum wheat [17] and common bean [22].
The most stable genotypes identified by most of the univalent stability models were DAB 544 and DAB 478 whereas Red kidney and DAB 478 were identified by multivalent models. Different authors identified stable genotypes for legume crops, for example, common bean [25,32], field pea [28] and chickpea [30].
Concerning environments, GGE-biplot identified the most discriminating environment Melkassa, moderately discriminating environments Alem Tena and Arsi Negele and un-discriminating environments Areka, Gofa and Kokate. Previous studies indicated grouping environments, for example, chickpea [30] and ground nut [33].
Conclusion
The Spearman's rank correlation coefficient indicated a highly significant positive (P<0.01) correlation among ASV, S2di, Shukla’s variance and Wricke’s ecovalence. These models identified stable genotypes DAB 478 and DAB 544 in common. This showed the use of any of the four stability parameters was sufficient to estimate the stability of common bean genotypes studied across the six environments. According to AMMI bi-plot, stable genotypes in all test environments were Red kidney, DAB 478 and Melkadima. GGE bi-plot analysis showed the best performed genotypes across six testing environments DAB 544, Red kidney, DAB 478, DAB 532 and DAB 481. The AMMI bi-plot showed the interaction whereas GGE bi-plot indicated which genotype performed best in which environment. Genotype DAB 478 was identified as a stable genotype using both univariate and multivariate analysis.
Though various univariate and multivariate stability analysis models were used, multivariate models were advantageous over univariate models showing the relationship and pattern among two or more variables simultaneously and letting to predict the effect of a change in one variable on the other. Multivariate analyses models, AMMI and GGE bi-plot, identified the most stable and high yielding (seed yield greater than grand mean) common bean genotypes. Concerning univariate models, except Lin and Binn’s [15] which better explained genotypes seed yield performance than stability and coefficient of determination which more indicated fitness of the model used than stability, all the rest five univariate models can be used to study stability of common bean in Ethiopia. Thus, this study identified stability models that provided similar results among univariate ones and indicated the advantage of multivariate over the univariate models for the future stability study of common bean genotypes in Ethiopia.
Acknowledgement
The author would like to thank the Southern Agricultural Research Institute, Areka Research Center, and Ethiopian Institute of Agricultural Research, Melkassa Research Center for financial support and for providing study materials. Special thanks go to Dr. Birhanu Amsalu Fenta, national pulse crops improvement coordinator, for his kindness and technical support.
REFERENCES
- Food and Agricultural Organization (FAO). Cereal and Oilseed Research Centre, Agriculture and Agri-food Canada. 2010.
- Broughton WJ, Hernandez G, Blair M, Beebe S, Gepts P, Vanderleyden J. Beans (Phaseolus spp.)-model food legumes. Plant and soil. 2013;252:55-128.
- Asfaw A. Breeding for drought tolerance by integrative design: The case of common bean (Phaseolus vulgaris L.) in Ethiopia. Wageningen University, Wageningen. 2011.
- David G. Improved Bean Seed. Full-Scale Report. 2016;pp:1-12.
- Habtu A, Sache I, Zadoks JC. A survey of cropping practices and foliar diseases of common bean in Ethiopia. Crop Prot. 1996;15:179-186.
- Becker HC, Leon J. Stability Analysis in Plant breeding. Plant Breed. 1988;101:1-23.
- Lin CS, Binns MR, Lefkovitch LP. Stability Analysis. Where Do We Stand? Crop Sci. 1986;26:894-900.
- Hussein MA, Bjornstad A, Aastveit AH. Sasg x Estab A SAS program for computing genotype x environment stability statistics. Agron J. 2000;92:454-459.
- Wricke G. On a method of understanding the biological diversity in field research. Z Pflanzenzucht. 1962;47:92-96.
- Finlay KW, Wilkinson GN. The analysis of adaptation in a plant breeding program. Aust J Agric Res. 1963;14:742-754.
- Eberhart SA, Russell WA. Stability Parameters for Comparing Varieties1. Crop Sci. 1966;6:36-40.
- Pinthus MJ. Estimate of genotypic value. A proposed method. Euphytica. 1973;22:121-123.
- Shukla GK. Some statistical aspects of partitioning genotypeenvironmental components of Variability. Heredity. 1972;29:237-245.
- Sisay A, Sharma MK. Parametric and Non-Parametric Methods to Describe Genotype by Environment Interaction and Grain Yield Stability of Bread Wheat. Stat Appl. 2016;14:9-29.
- Lin CS, Binns MR. A superiority measure of cultivar performance for cultivar x Environment data. Can J Plant Sci. 1988;68:93-198.
- Gauche HG, Zobel RW. Predictive and postdictive success of statistical analyses of yield trials. Theor Appl Genet. 1988;76:1-10.
- Purchase JL. Parametric analysis to describe genotype x environment interaction and yield stability in winter wheat. Department of Agronomy, University of the Orange Free State, Bloemfontein, South Africa. 1997;pp:1-84.
- Payne RW, Murray DA, Harding SA, Baird DB, Soutar DM. GenStat for windows introduction, 17th ed. Hemel Hempstead, UK: VSN International. 2012.
- Zobel RW, Wright MJ, Gauch HG. Statistical analysis of a yield trial. Agronomy Journal. 1988;80:388-393.
- Yan W, Kang MS. GGE Biplot Analysis: A Graphical Tool for Breeders, Geneticists, and Agronomists. CRC Press, Boca Raton. 2002.
- Yan W, Kang MS, Woods BMS, Cornelius PL. GGE biplot vs. AMMI analysis of genotype-by-environment data. Crop Sci. 2007;47:643-655.
- Mekbib F, Kefelegn N. Genotype X Environment Interaction of Released Common Bean (Phaseolus Vulgaris L.) Genotypes, in Eastern Amhara Region, Ethiopia. Haramaya University, Dire-Dawa, Ethiopia. 2012;pp:1-82.
- Alberts MJA. A comparison of statistical methods to describe genotype x environment interaction and yield stability in multi-environment maize trials. University of the free state, Bloemfontein. 2004;pp:1-100.
- Issa BA. Genotype by Environment Interaction and Yield Stability of Maize Hybrids Evaluated In Ethiopia. Department of Plant Sciences/ Plant Breeding. University of the Free State. Bloemfontein, South Africa. 2009;pp:1-135.
- Abel MF. Genotype by Environment Interaction on yield and micronutrient concentration bio fortified common bean (Phaseolus Vulgaris L.) in Ethiopia. Haramaya University, Haramaya, Ethiopia. 2017;pp:1-129.
- Afework LW. Genotype X Environment Interaction and Stability Analysis of Some Promising Iluababora Coffee (Coffee Arabica L.) Genotypes for Yield and Yield Related Traits in Southwestern Ethiopia. Jimma University, Jimma, Ethiopia. 2017;pp:1-119.
- Kanko CC. Genotype by Environment Interaction of Yield and Yield Attributes of Potato (Solanum tuberosum L.) in Gamo Gofa and Segen people zones, Southern Region, Ethiopia. Hawassa University, Hawassa. 2018.
- Goa Y. Genotype X Environment interaction and stability analysis for yield and yield attributes of Field pea (Pisum Sativum). Hawassa University, Hawassa, Ethiopia. 2007.
- Samuel MK. Utilization of Multi-Environmental Pigeon pea Performance Data for Determination of Stability Parameters. Jomo Kenyatta University of Agriculture and Technology. Nairobi, Kenya. 2013.
- Legesse H, Hussein M, Walelign W, Bunyamin T. Genotype by Environment Interaction and Stability of chickpea (Cicer arientinum (L)) Genotypes in Southern Ethiopia. Hawassa, Ethiopia. 2015.
- Fekadu GB. Genotype by environment interaction and stability analysis for yield and yield attributes of soya bean [Glycine max (L) Merrill]. Hawassa University, Hawassa, Ethiopia. 2008.
- Ashango Z, Amsalu B, Tumisa K, Negash K, Fikre A. Seed Yield Stability and Genotype x Environment Interaction of Common Bean (Phaseolus vulgaris L.) Lines in Ethiopia. Int J Plant Breed Crop Sci. 2016;3:135-144.
- Debessa A, Alemu B. Genotype by environment interaction and kernel yield stability of Ground nut (Arachis hypogeae L.) in western Oromia, Ethiopia. J Agric Crop. 2016;2:113-120.
- Steel RG, Tories JH. Principles and Procedures of Statistics. McGrawHill Book Co. New York. 1960.
- Duarte JB, Zimmerman MJDO. Correlation among Yield Stability Parameters in Common Bean. Crop Sci. 1995;35:905-912.
- Jalaluddin MD, Harrison SA. Repeatability of stability estimators for grain yield in wheat. Crop Sci. 1993;33:720-725.
- Rezene Y, Bekele A, Goa Y. GGE and AMMI Biplot Analysis for Field Pea Yield Stability in SNNPR State, Ethiopia. Int J Sustain Agric Res. 2014;1:28-38.
Citation: Bassa D, Gurmu F, Mohammed H (2019) Comparison of Univariate and Multivariate Models to Analyze Stability of Common Bean (Phaseolus vulgaris L.) Genotypes in Ethiopia. Agrotechnology 8:188.
Copyright: © 2019 Bassa D, et al. This is an open-access article distributed under the terms of the Creative Commons Attribution License, which permits unrestricted use, distribution, and reproduction in any medium, provided the original author and source are credited.
