PMC/PubMed Indexed Articles
Indexed In
- Open J Gate
- Academic Keys
- JournalTOCs
- ResearchBible
- RefSeek
- Hamdard University
- EBSCO A-Z
- OCLC- WorldCat
- Publons
- Geneva Foundation for Medical Education and Research
- Euro Pub
- Google Scholar
Useful Links
Share This Page
Journal Flyer

Open Access Journals
- Agri and Aquaculture
- Biochemistry
- Bioinformatics & Systems Biology
- Business & Management
- Chemistry
- Clinical Sciences
- Engineering
- Food & Nutrition
- General Science
- Genetics & Molecular Biology
- Immunology & Microbiology
- Medical Sciences
- Neuroscience & Psychology
- Nursing & Health Care
- Pharmaceutical Sciences
Research Article - (2019) Volume 7, Issue 1
Cohort analysis of gender gap after one hundred years old: the role of differential migration and survival trajectories
Graziella Caselli1*, Marco Battaglini2 and Giorgia Capacci22Italian National Institute of Statistics, Directorate for Social Statistics and Population Census, Rome, Italy
Received: 24-Oct-2018 Published: 02-Jan-2019, DOI: 10.35248/2329-8847.19.07.199
Abstract
The persistence of mortality decline at all ages, and particularly at older ages, means that an increasing number of individuals are becoming centenarians and semi-super centenarians. Our hypothesis is that the gender differences in mortality level in old ages had an impact on the number of men and women reaching 100 years and so on the gender gap. Work-related international migration was also an important characteristic of Italian cohorts born in the last decades of the Nineteenth century, and in the first decades of the Twentieth, as these migrations affected more men than women.
Referring to the Istat (Italian National Institute of Statistics) mortality data (Cause of Death Survey and Deaths of Resident Population survey) and the Semi super and Super centenarians Surve -SSC, that has been realized by Istat since 2009, the aim of this paper is to present the development of the gender gap for the cohorts born between 1870 and 1912 beyond 100 and 105 years old. We have confirmed our hypothesis, explaining the characteristics of this development on the basis of estimates of the role played by the different migratory histories of the two genders and, above all, by the differences in the male and female survival trajectories of the cohorts in the study.
Keywords
Centenarian; Survival; Survey; Gender
Introduction
In the new millennium the number of centenarians (aged 100 and over) and semi-supercentenarians (aged 105 and over) has increased to such an extent as to capture the interest of academics from various disciplines in search of the causes of longevity [1]. Some researchers are trying to monitor these individuals, using various methodologies to count them and, above all, to confirm that their stated age is actually true. Age validation is still the most important prerequisite for any study of this population [2,3]. Its absence is likely to bias the calculation of centenarian or semi-supercentenarian rates, the differences in gender gap at these ages and, consequently, any explanation of this extreme differential longevity [4].
The persistence of mortality decline at all ages, and particularly at older ages, means that an increasing number of individuals are becoming centenarians and semi-supercentenarians too [4]. Women are more likely to cross these thresholds, and to such an extent that in low-mortality countries there are 5 to 7 women per man beyond the age of 100 years. In Italy population counts show that the femininity ratio (FR: the number of women per man) at the age of 100 years was approximately 5 on January 1st 2018 [5]. The gender differences in mortality level, particularly in old ages, have had an impact on the number of men and women reaching 100 years. Work-related international migration was also an important characteristic of Italian cohorts that reached the age of 100 and above in the last decades of the twentieth century, especially for those born between 1880 and 1899, and in the first decade of the present century [6,7]. According to Wikipedia (2018), 29 million Italians left the country between 1891 and 1940, 10 million of whom returned, but the remaining 19 million, who mainly belonged to these cohorts, stayed abroad permanently [8].
These migrations affected more men than women. In fact, two thirds of the migrants who left Italy in the nineteenth century and in the years before the First World War were men. Many left to work in the Americas before the conflict or went to work elsewhere in Europe too after the war [6,7].
Ageing and longevity are very topical questions on today’s agenda. As we said, new statistical data on the oldest old and on mortality up to extreme ages over time and by cohort, are able to reveal the time and age pattern of survival improvements at least up to 100 years, and significantly improve our understanding of some aspects of the differential between men and women in longevity. Although the increase in the number of people aged 100 years is well documented today in countries with advanced demographic data, the same cannot be said for those aged 105 years and over, and still less for those of 110 years and over [9]. But, for large countries like Italy, it is still impossible to follow and validate the individuals still alive at age 100 because the number of those who reach this age is in Italy already very high (at January 1st 2018, about 16,000, 13,090 women and 2,557 men, an FR equal to 5.1) and we know that the doubling time is equal to 12 years starting from January 1st 2002 [5]. We therefore prefer to count them at the time of death, trusting in the reliability of the death certificates, but, of course, we need to await the death of the last individual still alive for each cohort. The number of those who reach and exceed 105 alive is therefore smaller and the researchers interested in extreme human longevity decided to establish the International Database on Longevity-IDL by gathering validated demographic data alive and dead on semi-super and supercentenarians. IDL is the Database at the University of Montpellier, and MPIDR as an international collaborative effort of researchers interested in extreme human longevity by gathering validated demographic data on supercentenarians, and now semi-supercentenarians too [10].
The Italian National Institute of Statistics (Istat) has been involved in collecting the data on semi super and supercentenarians (110 and over) since 2009, when the IDL protocol set up the SSC survey to specifically investigate this question. This survey has collected data about living and dead individuals aged 105 and over for the cohorts born between 1896 and 1912 by their birth and place of residence [4,11]. We have made use of this information, together with that on deaths from 100 to 105 years, collected in other Istat surveys, and on life tables available for dead cohorts born after 1870 and now extinct.
Referring to all the available information, the aim of this paper is to present the development of the gender gap for the cohorts born between 1870 and 1912 beyond 100 and 105 years old, and to explain the characteristics of this development on the basis of estimates of the role played by the different migratory histories of the two genders and, above all, by the differences in the male and female survival trajectories of the cohorts in the study.
Data Collection and Methods
Since 2008 the Italian National Institute of Statistics has started a new survey (SSC survey) in order to collect data about semi-super and supercentenarians, starting from the Posas survey, a survey carried out by Istat on the resident population of the Italian municipalities (about 8,000), broken down by gender, cohort and marital status on January 1st of each year. (Posas is an Italian Acronym for Resident Population by Age, Sex and Marital Status).
Each municipality which has reported residents aged 105 and over on the statistics form is then contacted by Istat in order to collect more detailed information; the SSC survey enables us to identify persons of these ages (105 and over) that should be validated by a birth certificate if a super-centenarian and by a certificate of living existence if semi-super, and by a death certificate at the end of life. Those still alive at age 105 and over are then 'followed' year by year until death, which is then added to the database (date of death). As long as the individual remains alive, the validation process never stops and each single year we proceed to "re-validate" the data observed in the past.
The variables needed for the validation and included in the SSC survey are: Name, Date of Birth, Date of Death, Completed age in YYDD (calculated variable), Place of Birth, Place of Residence (last), Marital Status (last), Citizenship (last), Year of Birth, Presence/absence in the database t, t+1, Note: All information on SSC including newspaper information or migration from/to other municipality.
In order to build a database as complete as possible we have linked the SSC database with other Istat surveys: Cause of Death Survey and Deaths of Resident Population survey. Thanks to the integration of the data from the SSC, Cause of Death and Deaths of Resident Population surveys the database that we have used is the most complete and accurate that is now available in Italy and certainly one of the best available in the world for semi-super and supercentenarians. In synthesis:
• For semi-supercentenarians of the cohort 1896-1912 still alive or deceased after 2009 we used the SSC survey data (2009-2017 years), and for those deceased before 2009 (extinct cohorts 1870-1895) we used Cause of Death survey 1969-2008 years.
• For centenarians aged 100-104 we used Cause of Death survey 1969-2010 years, and Deaths of Resident Population survey 2011-2017 years.
Furthermore, we have completed Caselli’s cohort life tables (constructed for age 0-100) for the cohorts 1870-1912 from age 100 and over, applying Vincent’s Extinct-Cohort Method (1951) [12]. For the cohort life tables one may refer to Caselli and Capocaccia, 1989; Caselli and Reale, 1999; Caselli, 2016 [13-15]. Graziella Caselli has contributed to Italian cohort life tables in the Human Mortality Database (MPDR) by supplying data for old cohorts. The cohorts 1902-1912, at the time of writing, are not completely extinct, but we know the alive person in SSC survey.
Starting from the cohort’s last survivor, we have determined the number of survivors at any age x after 100, by successively combining the deaths observed at the preceding ages. In this case if the survivors at age x (x=100) are Sx and the deaths d(x,x+1) are exactly, by hypothesis, those of the life table being sought: constructing in this manner, however, the radix of our table is 100. We can obviously have the survivors of the life tables at every age from 100 to ω. In the last step we have linked this end-of table to the table computed using the classic method for the previous ages, in this way we have the whole survival trajectories of the cohorts considered [4].
Finally, in order to build Centenarian rates, we used data of national birth statistics by gender for the cohorts born from 1870 to 1912 [16].
Results and Discussion
On the basis of data of Death surveys and the data of the SSC survey, in Italy there are 104,715 centenarians in the cohorts born between 1870 and 1912, of whom 85,198 are female and 19,517 male, signifying a ratio of 4.4 women for every man; 8,669 of them have reached the age of 105, 7,530 of them female and 1,139 male, signifying no fewer than 6.6 women for every man (Table 1). If we restrict ourselves to semi-supercentenarians in the SSC survey (i.e. the cohorts born between 1896 and 1912) validated as still alive on January 1st of each year from 2009 to 2018, there are 5,459, of whom 1,091 were still alive on January 1st 2018 and 4,368 died between 2009 and the end of 2017. In all, the women number 4,799 and the men 660, with an FR equal to 7.3, in the largest set of all of the cohorts born between 1870 and 1912.
| Some Cohorts | Centenarians | Femininity ratios-FRs | Semi-supercentenarians | Femininity ratios-FRs | ||
|---|---|---|---|---|---|---|
| Men | Women | Men | Women | |||
| 1870 | 89 | 224 | 2.5 | 5 | 15 | 3 |
| 1880 | 160 | 412 | 2.6 | 5 | 24 | 4.8 |
| 1890 | 294 | 1,088 | 3.7 | 18 | 85 | 4.7 |
| 1900 | 508 | 2,520 | 5 | 30 | 212 | 7.1 |
| 1910 | 1,346 | 6,383 | 4.7 | 81 | 586 | 6.5 |
| 1870-1912 | 19,517 | 85,198 | 4.4 | 1,139 | 7,530 | 6.6 |
Table 1: Centenarians and semi-supercentenarians and Femininity ratios- FRs for the cohorts born from 1870 to 1912 and for some of them, starting from the data of the SSC survey and Deaths survey. Italy.
The centenarians of the last 7 cohorts are about half of all 43 cohorts (1870-1912), which means that for the most recent cohorts this part of the population doubles more and more quickly: every 10.1 years for men and 8.4 for women. The supercentenarians confirmed in the SSC survey show a doubling time equal to 9.4 years if men and 7.5 if women. First of all, it is worth clarifying the reasons for the significant increase in the centenarians and supercentenarians from one cohort to the next, quite apart from the two genders. Referring to the ratio of the number of centenarians and/or semi-supercentenarians to the number in the birth cohort by gender (N100/B per 10,000 and N105/B per 100,000) in Figure 1 we see that the growth is constant for women and much more rapid and significant when we come to the cohorts of the new century, both at 100 and at 105 years and over, while for the men, though they start from levels close to those of the women, it is only from the cohorts born in the new century that we can see a more substantial and rapid growth [17-19]. In fact, the total number of centenarians per 10,000 births in Italy is 1.8 for men and 4.9 for women of the 1870 cohort, while the same proportion is 27.2 for men and 129.4 for women of the most recent cohort.
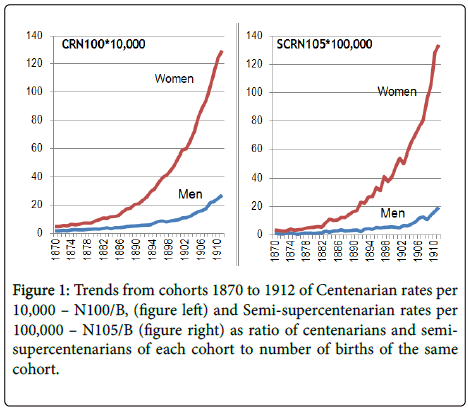
Figure 1: Trends from cohorts 1870 to 1912 of Centenarian rates per 10,000 N100/B, (Figure left) and Semi-supercentenarian rates per 100,000-N105/B (Figure right) as ratio of centenarians and semisupercentenarians of each cohort to number of births of the same.
Compare to women, the proportions tend to be low for male centenarians, but especially for semi-supercentenarians, are those we find in the cohorts directly involved in the First World War.
The differentiated development for men and women of these ages has obviously produced an increase in the gender gap. In effect, the Femininity ratios indicated in Figure 2 clearly show the increase in the gender gap as we move from the first to the last cohort. The FR varies between 2.5 and 3 women per man at 100 and 105 years respectively for the first cohorts, when the values are around 5 and 7 respectively for the last cohorts, with a growth trend that nevertheless seems to slow down if we consider only the cohorts born in the new century, particularly after the cohort of 1907, when the cohorts that most benefited from the decline in mortality due to what is known as the cardiovascular revolution in the earlier 1970s, entered the period of old age [20]. Men too enjoyed these benefits, and it is thanks to them that the gap between them and women began to shorten (Figure 2).
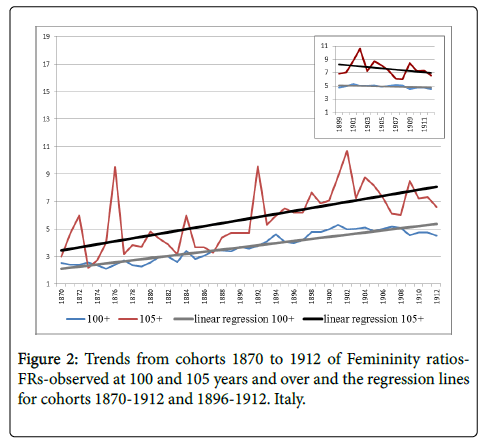
Figure 2: Trends from cohorts 1870 to 1912 of Femininity ratios- FRs-observed at 100 and 105 years and over and the regression lines for cohorts 1870-1912 and 1896-1912. Italy.
It is important to note in Figure 2 that the FR increases with age (from 100 to 105) to the advantage of women, as an evident sign that their mortality levels are still lower than their male peers even after 100 years. More of them reach the threshold of 100 years, and they are more likely than men to reach the age of 105 and over.
The role of international migration
In analyzing the values of the FRs and their development, we cannot fail to comment on the differential role between the two genders played by migration as well as mortality. It is well known that international emigration in the nineteenth and twentieth centuries involved more men than women, but we know that the mortality levels at every age of life, and particularly in old age, were higher for the former than the latter [15]. Hence, both factors had the effect of reducing the probability of men reaching the threshold of 100 years and, still less, that of 105 years.
Regarding the role played by migration on the gender gap, as we could consult the life tables for all the cohorts in our study, we wanted to see which individuals would reach 100 years in the absence of migration. That is to say, we applied to those born from the men and women of every cohort the probability of survival from birth to 100 years, assuming that if the migrants had remained in Italy they would have had the same probability of survival to 100 years as the nonmigrants. We therefore calculated the FREs on the values expected and compared them with the FRs observed. The distance between the two curves in Figure 3 underlines the effect of the differential development of the gender gap produced by net migration (considering negative or positive the balance between emigrants and returning migrants). Without migration, we could have counted 3.5 centenarian women for every man in the set of cohorts 1870-1912, while the values observed give a estimate of 4.4. About one point of the observed FR seems ascribable to the role of international migration. A comparison of the expected and observed values from the first to the last cohort also brings out an increase in the gap, underlining that the cohorts most affected by international migration were those born in the last years of the nineteenth century and the first decade of the twentieth century. For men of the cohorts 1899-1912, the negative balance is very important as at age 100 and over the differences between observed (12,547) and waited population (15,990) is 3,433 centenarians. For women the same differences are closed to zero. The interpolation of FR observed and estimated with a third-order polynomial model (confidence interval equal to 95%) shows that the differences in the oldest cohorts are not significant (for the cohorts with low migration), while they become so starting from the cohorts of 1885-1886, when international migration increased (Figure 3).
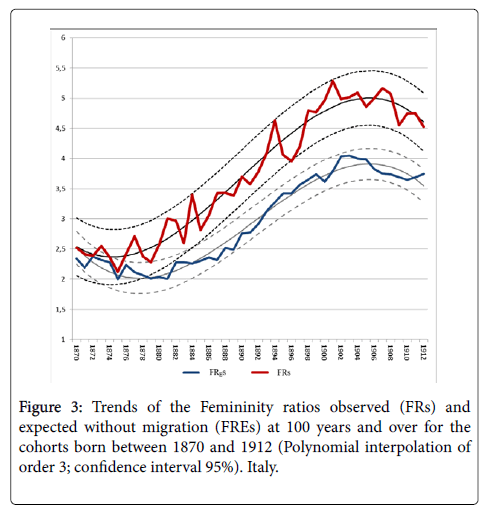
Figure 3: Trends of the Femininity ratios observed (FRs) and expected without migration (FREs) at 100 years and over for the cohorts born between 1870 and 1912 (Polynomial interpolation of order 3; confidence interval 95%). Italy.
If the mortality differential alone had been at work, without the effect of migration, the gap between men and women would have been much smaller and we would certainly have had more male centenarians than those we have observed.
The role of survival differences
If we leave aside the role of migration, the trend that we can see moving from the first to the last cohort, is clearly explained merely by the differential development of survival and hence of differential mortality between men and women. But at what ages of life did this differential development begin to produce the gap between the two genders that we note at the threshold of 100 years? In Figure 4, comparing the gap of the survival functions of the male and female life tables for the cohorts of 1870 (the first) and 1912 (the last), we may note that it is only towards 60 years that the gap between men and women increased. To fully evaluate this aspect, we may refer to the ‘stationary’ population of the male and female life tables of the cohorts 1870-1912. This population in its various ages (named Lx) is, as is generally known, obtained by half the sum of the survivors of the life tables between two succeeding ages (Sx+Sx+1]/2) and is, by definition, a population closed to migratory movements. The FRLxs calculated starting from the Lx for three different ages is illustrated in Figure 5, and they increase with the increase of age, starting at 60 from fairly low values, and particularly after 80 years old. The FRLxs for each cohort at 100 years are, as expected; close enough to those FREs that is, in the absence of migration (Figure 5). The two ratios refer to the same life tables, then the very low differences observed in Figure 5 between the two Femininity ratios are due to the fact that the first are calculated starting from a simple average of the survivors of the life tables between two successive ages, as 100 and 101, and the second is referred to those born of every cohort still alive at age 100 exactly, considering the survival probability from 0 to 100 years.
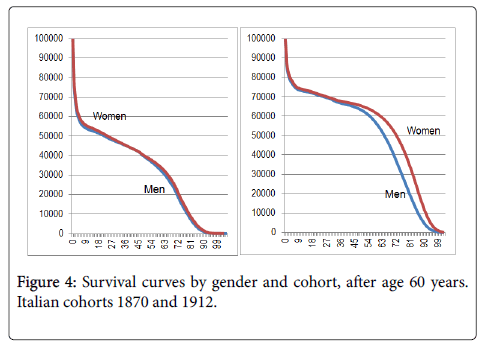
Figure 4: Survival curves by gender and cohort, after age 60 years. Italian cohorts 1870 and 1912.
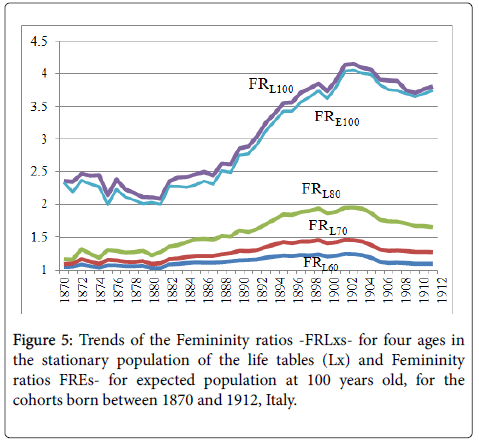
Figure 5: Trends of the Femininity ratios -FRLxs- for four ages in the stationary population of the life tables (Lx) and Femininity ratios FREs- for expected population at 100 years old, for the cohorts born between 1870 and 1912, Italy.
We can reasonably state that the difference in female and male survival functions, which begins at around the age of 60 and continues for all following old ages, is what has enabled more women to reach the thresholds of 100 and 105 years (Pearson correlation between cohort survival probability from 60 to 90 and the number of centenarians by cohort is 0.99 and 0.98 for men and women respectively). To have a clearer and complete idea of the action of the different behavior of the male and female survival trajectories after age 60 for the cohorts under study, it is interesting to refer to differences between the male and female survivors (Sx) in the life tables, illustrated in Figure 6. We can see that these differences are always positive and that the women have had the advantage right up to extreme old age. We can also see that, as we move from the first cohorts to those more recent, the years of life gained by women over men have been gradually increasing till the age of 80 years, remaining very high up to the threshold of 90 years, particularly for the twentieth-century cohorts, after which there begins an obvious convergence, although each distance remains always favorable to women. In synthesis, the most recent female cohorts, who have taken full advantage of the decline in mortality in old age in the post-war period and the 1970s-the years of what is known as the cardiovascular revolution reached the threshold of 100 years in greater numbers than their male peers, because they had been able to enjoy a greater number of years gained in the immediately preceding ages [20].
Indeed, referring to the life tables, in the female cohort of 1870 half the survivors at 60 died before reaching 76 years, while in the 1912 cohort half of them were still alive at 84 years. Moreover, whereas only 6.4% of the 1870 cohort reached the age of 90, four times that number, 25.9%, of the 1912 cohort were still alive. At the age of 100 the proportion rose by 0.1% and 2.6%, respectively. The survival curve for men at once brings out the significance of old-age mortality on the differences observed between the two genders in the number of centenarians and, obviously, the semi-supercentenarians. Men have recouped far fewer years of life: for the first cohort, 50% died before reaching the age of 72, and for the last, before 78. Only 4.0% and 12.0%, respectively, of the initial 60-year olds reached the age of 90, against, as we have seen, 6.4% and 25.9% for women. The number of men reaching 100 is very limited: 0.05% of the 60-year olds of cohort 1870, and little more than 0.8% for that of 1912 [4].
It is interesting to consider the left-hand side of Figure 6 and refer to the lines of differences with the cohorts with higher values than those indicated in bold for the last cohort of 1912. For a group of these cohorts 1896-1906 the survival differences to the advantage of women were particularly high between 60 and 78 years. This behavior involves the cohorts that took part in the First World War at younger ages (1896-1900), but also those born between 1902 and 1906. For the former, their numbers reduced at young adult age by the losses in that conflict, they found themselves paying the consequences in later years too, at least until age 80, probably as a result of adopting habits such as cigarette smoking (widespread among soldiers during the First World War), which increased their risk of death, particularly from lung cancer [13,15]. This happened when the women in the same cohorts, who were immune from these risks, were starting to benefit from their first important progress in terms of survival.
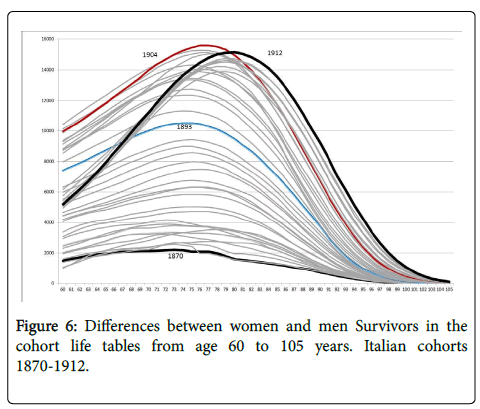
Figure 6: Differences between women and men Survivors in the cohort life tables from age 60 to 105 years. Italian cohorts 1870-1912.
For the second group, the cohorts 1902-1906, some researchers had already noted an excess of mortality up to 60 years for men [13,21]. This excess was thought due to the fact that these were individuals who were adolescents in the First War, belonging to cohorts who had first suffered the nutritional deprivation of the war years and then, as young adults, been involved in the post-war reconstruction of the country. They had suffered the effects of the risks deriving from working conditions that were often harmful to their health. Some of them had also been involved in the Second War. We now know that for these cohorts the mortality levels were higher than those of the previous and succeeding cohorts up to the age of around 80 years.
Generally, for the cohorts considered, we might speak of a generational habitus [22] that could influence the observed gender gap.
Conclusions
In this work, we have been able to examine the increase in the gender gap of the centenarians and semi-supercentenarians by cohort from 1870 to 1912, thanks to the data collected in different surveys by Istat, and in particular to the data of the SSC Italian survey. We have seen that the gender gap increases from the first to the cohort born in the first years of the new century. Men of the more recent cohorts enjoyed in old age the benefits of the mortality decline due to the cardiovascular revolution, and it is thanks to it that the gap between them and women began to shorten.
A clearer explanation of the importance of mortality development in old age in determining the increase in the gender gap between centenarians can be gained by looking at the growing differential in survival (Figures 4 to 6) between women and men after 60 years old particularly between 80 and 90 years old from one cohort to the next. However, in this paper we did not take into account that between the two genders, from one generation to the next, possible modifications in the heterogeneity of individual frailty provoke changes in the population’s survival function in the oldest old ages [23]. In other terms, in comparing the trend of survival function by cohort and gender we did not consider the possible role played by the selection effects on the gender gap from 80 to 100-105 years.
But we have also seen that part of the gender gap observed among centenarians of the cohorts studied can be attributed to the role played by international migrations, which have certainly prevented a greater number of men than women of the same cohorts from becoming centenarians in Italy. Thus, for example, the observed FR equal to 5.3 that we find for some cohorts of the twentieth century could have been equal to 3.5-4 (FREs), had there been no migration assuming, obviously that the migrants’ survival probabilities had been the same as those for non-migrants.
Estimating the role of migration is certainly important, as we can see comparisons with other countries in a different light. In many works and in international meetings the proportions of centenarians out of the total population are often classified, and it emerges that, though Italy is one of the highest in the list, it is placed, for example, after France (122 in Italy and 168 in France per 100,000 inhabitants in 2017). Yet, France is a country that took in around 3.5 million of Italian men and women and other nationalities too in the years between 1891 and 1940 [8]. Similarly, if we check the IDL database for supercentenarians (110 years and over), we find many Italian names and surnames, particularly for the American supercentenarians, but also, for example, among the Belgians, and often these names are female. Clearly, there were Italian women who emigrated, and lived and resided abroad, who reached the threshold of 110 years.
Similarly, it has often been underlined that the FR among Italian centenarians shows lower values than those of many other European countries that in the past had received significant migratory flows from Italy both men and women. To stay with the previous example, in France there are around 9 female centenarians for every man for the cohort 1910, while in Italy there are 5 [3,22]. We find the same comparisons within Italy: for example, in Lombardy a region of immigration the FR among centenarians is equal to 8, while in Calabria a region of emigration it is lower than 3 [5].
For the centenarians and semi-supercentenarians born in the first decades of the twentieth century, the internal migrations from South to North and from Eastern to Western regions of the country were equally important [24]. The next stage in our work will be to analyze the regional differences in the gender gap for the validated semisupercentenarians, as for them we can refer to the data available for the cohorts 1896 to 1912 collected in the SSC survey by place of birth and place of residence. This information would make clear how many semi-supercentenarians resident in each region were also born in that region, and how many of those residents were born elsewhere. Indirectly, we could calculate the number of individuals who certainly left their region of birth to live or die after 105 years in another region, and know if they mainly belonged to one gender or the other.
The geographical disparities in FR have triggered a number of enquiries about the possible role of specific genetic characteristics [25-27]. However, the phenomenon is not exclusive to this age group, but results from demographic dynamics of much earlier origin [14,30]. The literature dealing with the high gender gap to the detriment of men at extreme ages is considerable. Demographers, epidemiologists, biologists and geneticists have developed several hypotheses to explain the phenomenon [22,31-34]. The descriptive studies refer to the different life history of individuals [35,36]. In this work we have also seen how the male cohorts most directly involved in the First World War, like those that took part in the post-war reconstruction of Italy, are those who have the lowest survival rate in old age and therefore also the smallest number of men who become centenarians compared with the women of the same generations. There have been very few studies that have examined the phenomenon, taking into consideration the role of differential migrations of the two genders. These could explain some of the great differences that there are between countries and within the same country. Considering the geography of the centenarian gender gap with reference to the regional data of the Italian SSC survey of the validated semi-supercentenarians could help us to consider the role of internal migrations on the important differences that exist between the northern and southern regions of Italy. The results may also give indications as to the direction of future research, developing, for example, the study at municipal level so as to identify geographical areas of particular significance for the phenomenon, as has been done for the ‘bleu zone’ of Sardinia [17,18,37].
Acknowledgements
We thank Mr. Gianni Corsetti (Istat) for valuable advices in the methodological aspects of this paper, and Mrs. Silvia Capuano (Istat) for having actively participated in the collection and validation of data of Semi-super and supercentenarians survey.
REFERENCES
- Willcox DC, Willcox BJ, Poon LW (2010) Centenarian studies: Important contributors to our understanding of the aging process and longevity. Curr Gerontol Geriatr Res 2010: 454829.
- Jeune B, Vaupel JW (1999) validation of exceptional longevity. In: Odense monographs on population aging (6th Edn). Odense University Press, Odense, Denmark.
- Allard M, Robine JM (2000) Les centenaires français. Etude de la Fondation IPSEN, 1900-2000. Serdi Editions, Paris, France.
- Caselli G, Battaglini M, Capacci G (2018) Beyond one hundred: A cohort analysis of Italian centenarians and semi-supercentenarians, J Gerontol B Psychol Sci Soc Sci Mar 26: gby033
- Istat (2018) Popolazione Residente per età, sesso e stato civile al 1° gennaio.
- Sori E (1984) L'emigrazione italiana dall'Unità alla Seconda Guerra Mondiale. Il Mulino, New York, USA.
- Caselli G (2006) International migration in the 20th century: The case of the western Countries. In: Caselli G, Vallin J and Wunsch G (eds.) Demography: Analysis and synthesis- a treatise in population studies. (2nd edn.) Academic Press-Elsevier, USA, pp. 267-292.
- Wikipedia (2018) Emigrati italiani: Dove e quanti in 140 anni.
- Robine J-M and Vaupel JW (2001) Supercentenarians: Slower ageing individuals of senile elderly? Exp Gerontol 36: 915-930.
- Robine J-M, Gampe J, Cournil A, Vaupel JW (2000) IDL, The International Database on Longevity, INSERM, Montpellier, France, Max Planck, Institute for Demographic Research, Rostock, Germany.
- Battaglini M, Capacci G, Corsetti G, Marsili M (2012) Semi-super and supercentenarians in Italy: Implementation of a longitudinal database. European Population Conferecence. EAPS, Stockholm, Sweden.
- Vincent P (1951) La mortalite´ des vieillards, Popul 6: 181-204.
- Caselli G, Capocaccia R (1989) Age, period, cohort and early mortality: An analysis of adult mortality in Italy, Popul Stud 43: 133-153.
- Caselli G, Reale A (1999) Does cohort analysis contribute to the study of the geography of mortality? Genus 39: 37-60.
- Caselli G (2016) The gender gap in survival: A new perspective. Ital J Gender-Specifi c Med 2: 75-82.
- Istituto Centrale di Statistica (1965) Movimento naturale della popolazione nelle regioni, in Sviluppo della popolazione Italiana dal 1861 al 1961. Annali di Statistica 94: 688- 689.
- Poulain M, Pes GM, Grasland C, Carru C, Ferrucci L, et al. (2004) Identification of a geographic area characterized by extreme longevity in the Sardinia island: The AKEA study. Exp Gerontol 39: 1423-1429.
- Poulain M, Pes GM, Carru C, Ferrucci L, Baggio G, et al. (2006) The validation of exceptional male longevity in Sardinia. In: Robine JM, Crimmins EM, Horiuchi S, Zeng Y (eds.), Human Longevity, individual life duration and the growth of the oldest-old population. Springer Berlin, Germany. pp. 146-166.
- Robine JM, Caselli G, Rasulo D, Cournil A (2006) Differentials in the femininity ratio among centenarians: Variations between northern and southern Italy from 1870. Popul Stud 60: 99-113.
- Vallin J (2006) Mortality differences by sex among the oldest-old. In: Robine JM, Crimmins EM, Horiuchi S, Zeng Y (eds.), Human Longevity, individual life duration and the growth of the oldest-old population. Springer Berlin, Germany. pp. 333-352.
- Wilmoth J, Vallin J, Caselli G (1990) When does a cohort's mortality differ from what we might expect? Popul 2: 93-126.
- Balard F, Beluche I, Romieu I, Willcox DG, Robine JM (2011) Are men aging as oaks and women as reeds? A behavioral hypothesis to explain the gender. Paradox of French Centenarians. J Aging Res 2011: 371039.
- Barbi E, Caselli G, Vallin J (2003) Trajectories of extreme survival in heterogeneous population. Popul 58: 43-66.
- Bonifazi C, Heins F (2011) La mobilità interna nei 150 anni di storia unitaria, in Italia 150 anni. In Avveduto S (eds.) popolazione, welfare, scienza e società. Gangemi Editore, Rome, Italy, pp. 51-56.
- Koenig R (2001) Sardinia’s mysterious male Methuselahs. Science 291: 2074-2076.
- Yashin AI, De Benedictis G, Vaupel JW, Tan Q, Andreev KF, et al. (2000) Genes and longevity: Lessons from studies of centenarians. J Gerontol A Biol Sci Med Sci 55: B319-B328.
- Passarino G, Calignano C, Vallone A, Franceschi C, Jeune B, et al. (2002) Male/female ratio in centenarians: a possible role played by population genetic structure Exp Gerontol 37: 1283-1289.
- Barbi E, Caselli G (2003) Selection effects on geographical differences in survival Genus 2: 37-62.
- Caselli G, Reale A (1983) The contribution of cohort analysis to the study of the geography of mortality? Genus 39: 27-60.
- Robine JM, Caselli G (2005) An unprecedented increase in the number of centenarians Genus 61: 57-82.
- Wallace JE (1996) Gender differences in beliefs of why women live longer than men. Psychol Rep 79: 587-591.
- Perls T, Fretts R, Daly M, Brewster S, Kunkel L, Puca A (2001) Genes and centenarians, in Robine JM, Kikwood TBL, Allard M (Ed.) Sex and longevity: Sexuality, gender, reproduction, parenthood. Fondation Ipsen and Springer: pp. 43-58.
- Seely S (1990) The gender gap: Why do women live longer than men? Int J Cardiol 29:113-119.
- Franceschi C, Fabris N (1993) Human longevity: The gender difference. Aging 5: 333-336.
- Mauger G (1989) The theory of generations of K. Mannheim and the theory of habitus. Annales de Vaucresson 30: 59-78.
- Franceschi C, Motta L, Valensin S (2000) Do men and women follow different trajectories to reach extreme longevity? Italian multicenter study on centenarians (IMUSCE). Aging 12: 77-84.
- Caselli G, Pozzi L, Vaupel JW, Deiana L, Pes GM (2006) Family clustering in sardinian longevity: A genealogical approach. Experimental Gerontol 41: 727-736.
Citation: Caselli G, Battaglini M, Capacci G (2019) Cohort Analysis of Gender Gap after One Hundred Years Old: The Role of Differential Migration and Survival Trajectories. J Aging Sci 7: 199. doi: 10.35248/2329-8847.19.07.199
Copyright: © 2019 Caselli G, et al. This is an open-access article distributed under the terms of the Creative Commons Attribution License, which permits unrestricted use, distribution, and reproduction in any medium, provided the original author and source are credited.
