PMC/PubMed Indexed Articles
Indexed In
- Open J Gate
- Genamics JournalSeek
- Academic Keys
- JournalTOCs
- ResearchBible
- Ulrich's Periodicals Directory
- Access to Global Online Research in Agriculture (AGORA)
- Electronic Journals Library
- RefSeek
- Hamdard University
- EBSCO A-Z
- OCLC- WorldCat
- SWB online catalog
- Virtual Library of Biology (vifabio)
- Publons
- MIAR
- Geneva Foundation for Medical Education and Research
- Euro Pub
- Google Scholar
Useful Links
Share This Page
Journal Flyer

Open Access Journals
- Agri and Aquaculture
- Biochemistry
- Bioinformatics & Systems Biology
- Business & Management
- Chemistry
- Clinical Sciences
- Engineering
- Food & Nutrition
- General Science
- Genetics & Molecular Biology
- Immunology & Microbiology
- Medical Sciences
- Neuroscience & Psychology
- Nursing & Health Care
- Pharmaceutical Sciences
Research Article - (2021) Volume 0, Issue 0
Characterizing the Impact of COVID-19 on the Global Stock Indices through Comparative Analysis
Jeffhraim Balilla*Received: 21-May-2021 Published: 11-Jun-2021, DOI: 10.35248/2155-9597.21.s10.005
Abstract
This paper shows the impact of COVID-19 on the global stock indices through the use of comparative analysis. Stock indices are presented by regions (Africa, Americas, Europe, Asia, and Oceania) and national stock indices are compared based on historical data. A 2:4 month ratio is used as a “window” for observing the changes in the movement of the price of indices from November–December 2019 and January–May 2020 respectively. COVID-19 infection count, recovery rate, and death rate are identified in each country from the first case recorded up to May 20, 2020. Based on analysis it appears that there is no sufficient evidence to conclude that the changes in the value of indices is affected by the COVID-19 infection count (p-value=0.9129). In Africa, only INDZI (Zimbabwe) showed a positive change of price in percentage points (1.39%) for January to May 2020 with 51 confirmed COVID-19 cases. In Asia, only SZSE (China) showed a positive mean change of price in percentage points (0.07%) in the same period with 82,971 confirmed cases. Similarly, in Europe, only OMXC20 (Denmark) showed the same with (0.09%) with 11,182 confirmed cases. In the Americas, NYSE Arca (US), Nasdaq100 (US), and MERVAL (Argentina) showed a positive mean change in price in percentage points (0.31%, 0.20%, and 0.89%) with 1,620,902 and 9,918 confirmed cases respectively. On the other hand, in Oceania, both NZX 50 (New Zealand) and Sand P/ASX20 (Australia) showed a negative mean change in prices (-0.03 and -0.15) respectively. In general Asian and European indices suffered a 0.28% decrease in the mean change in daily prices as compared during November to December 2019. African indices on average stood to be the least affected with 0.11% mean change in daily prices as compared to -0.02% from November to December 2019.
Keywords
Stock market index; COVID-19; Pandemic; Global stock
Introduction
National stock indices represent the overall health of a country’s economy. Several studies suggest that “Black Swan” events which include terrorism, extreme natural events, wars, and pandemics affect the stock prices. Although there is still an on-going debate whether COVID-19 pandemic can already be considered a “Black Swan”, unprecedented damages in the global economy has already been observed. Chen et al. showed that during the SARS outbreak in 2003, Taiwan’s stock market was negatively affected by the outbreak. In particular, the hospitality industry was the most sensitive and the stocks in this industry tend to respond to similar disasters such as the Bird Flu outbreak. Similar results have been observed by a more recent survey by Xu et al. Where 40% of the surveyed hotel operators suffered an 80%-100% decrease in revenues [1]. However, during the SARS outbreak, Taiwan’s biotech firms had experienced positive shocks in the face of the crisis. The same is being observed in the current pandemic where pharmaceutical companies are observing positive growth [2]. Using available data, this paper examines the impact of COVID-19 on global stock indices. Stock indices are divided into 5 regions (Africa, Asia, Europe, Americas, and Oceania). Results showed that in general, all regions except Africa experienced negative growth. However, in the country level, only Zimbabwe in Africa sustained a positive growth for the period of January to May 20, 2020. In the Americas, only the US and Argentina showed positive growth. In Europe and Asia only Denmark and China sustained positive growth. The majority of the indices worldwide showed slowing down and most are already experiencing a significant decrease in value. Furthermore, the results of the analysis showed that there is no sufficient evidence to conclude that national stock indices are significantly affected by the number of COVID-19 cases. This result could be due to all countries implementing measures such as lockdowns, closure of non-essential businesses, and reducing economic activities to control or prevent the further increase in new infection regardless of having a low or a high infection count.
Materials and Methods
Comparative analysis is used in order to characterize and quantify the impact of COVID-19 to the global stock indices. Daily records of price and percentage change in price from November 21 to December 31, 2019, are used as a baseline or pre COVID-19 periods and January 1 to May 20, 2020, are used as intra-COVID-19 periods. A 2:4 month ratio is preferred as a “window” for observing the changes in daily prices since it allows reducing disturbances in prices that aren’t completely related to the COVID-19 pandemic. Also, the duration captures the effect of lockdown measures and closure of non-essential businesses as well as COVID-19 mitigation programs that affect the overall health of a country’s economy and stock indices. COVID-19 statistics in each country are identified and listed in terms of infection count and derived statistics are computed specifically, recovery rate and death rate. Correlation analysis is performed in order to identify significant interrelation between the mean changes of price of an index with the count of COVID-19 infection. Finally, data visualizations are used using daily changes of prices for each index in order to show the behavior of the indices from November 21 to May 20, 2020.
In Africa, Egypt sustained the most loss with EGX 30 suffering from -0.06% to -0.30% on average from November 21, 2019, to May 20, 2020. Egypt is one of the worst-hit countries in Africa with 14,299 COVID-19 confirmed cases as of May 20, 2020. Other African indices followed the same pattern except for INDZI (Zimbabwe) which observed an increase from -0.21% to 1.39% with the second-lowest COVID-19 infection count (51) (Figure 1). On the 20th of March Zimbabwe declared a state of disaster which imposed national lockdown and prohibition of public gatherings. Several economic stimulus measures were imposed which include the ff:
a) The Government of Zimbabwe has committed to provide financial assistance of 200 Zimbabwean dollars to vulnerable families.
b) The Securities Exchange Commission has extended the audited financial statement submission deadline from March 31, 2020 to May 31, 2020. Similarly, the quarterly return submission deadline has also been extended from April 14, 2020 to May 15, 2020.
c) The filing deadlines of listed companies has been extended to April 30, 2020. All Trading in securities of all issuers shall be done carefully during the lockdown period. Consequently there will be no need for issuers to issue individual cautionary statements. Every issuer is expected to provide an update on the special trading by May 15, 2020 including a statement on the solvency of the issuer in light of the pandemic and the lockdown order on its business.
d) The regulations on exchange have been amended and will take effect starting from March 29, 2020. The amendments allow any person to pay for services and goods that are chargeable in Zimbabwe dollars or in a foreign currency using free funds at the ruling rate on the date of payment. The payment through a foreign currency account or in cash can be done online through any electronic payment platform.
Results and Discussion
The economic stimulus proved to be effective with INDZI being the only index in Africa to sustain a positive growth from January to May 20, 2020 (Table 1) (Figure 1).
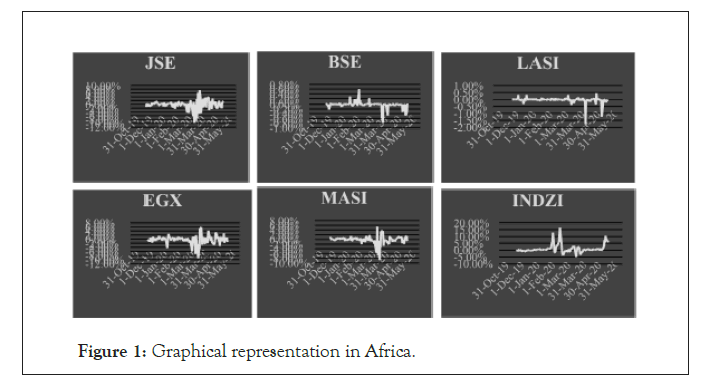
Figure 1: Graphical representation in Africa.
| Index | Country | Nov-Dec 2019 | % Change | Jan-May 2020 | % Change | COVID-19 infection count | Recovery rate (%) | Death rate (%) |
|---|---|---|---|---|---|---|---|---|
| INDZI | Zimbabwe | 779.75 | -0.21% | 1,428.37 | 1.39% | 51 | 35% | 8% |
| BSE | Botswana | 7,507.66 | -0.02% | 7,513.77 | -0.03% | 25 | 68% | 4% |
| LASI | Zambia | 4,262.74 | 0.01% | 4,213.14 | -0.05% | 832 | 24% | 1% |
| JSE | South Africa | 56,283.96 | -0.01% | 51,599.32 | -0.09% | 18,003 | 44% | 2% |
| MASI | Morocco | 11,945.15 | 0.16% | 10,863.28 | -0.24% | 7133 | 57% | 3% |
| EGX 30 | Egypt | 13,718.20 | -0.06% | 11,728.31 | -0.30% | 14,299 | 28% | 5% |
Table 1: Recovery rate and death rate in the covid infected people in Africa.
In the Americas, NYSE Arca, Nasdaq-100 (US), and MERVAL (Argentina) are able to sustain a positive mean change in price (0.30%, 0.14%, and 0.03%) respectively from January to May 2020. Although MERVAL suffered a decrease from 0.89% (November to December 2019) to 0.03% (January to May 2020) the economic measures employed by Argentina prove to be effective. Some of the economic stimulus employed by Argentina is the ff:
a) Based on AFIP 4693/2000 resolution, employers registered by the AFIP and who will register will enjoy a postponement of employer’s contributions from March to mid of June. The Committee on Emergency Assistance Program for Jobs and Production (CEAP) shall also identify possible additional measures for both the workers and employees.
b) The Emergency Assistance Program for Jobs and Production has been enacted with the ff:
b.1) Postponement of employer’s contributions to the Argentinian Social Security System.
b.2) Up to 95% reduction of the payment of employer contributions to the Argentinian Social Security System.
b.3) The Government of Argentina shall cover part of the workers’ wages subject to requirements. Also, vulnerable people over 60 years of age shall be given a labor license.
c) The Central Bank shall provide incentives to banks who will grant credits with preferential rates to small and medium companies for the payment of salaries.
d) Expansion of Ahora 12 program which provides incentives and financing programs for the consumption of national products including products from online platforms.
In the United States, the Coronavirus Aid, Relief, and Economic Security Act was signed into law on March 27, 2020. It’s the largest major legislative initiative specifically designed for COVID-19. This Act contains health-related provisions that are focused in addressing the outbreak in the country which includes the ff:
a) Insurance coverage for COVID-19 testing.
b) Paid sick leave.
c) Nutrition-related assistance.
d) Global response to COVID-19 programs.
Among other indices in the region, Brazil’s IBOVESPA incurred the highest decrease from 0.35% in November to December 2019 to -0.28% from January to May 2020. It’s next to the United States in terms of count of COVID-19 infection at 310,000 (Tables 2 and 3) (Figures 2 and 3).
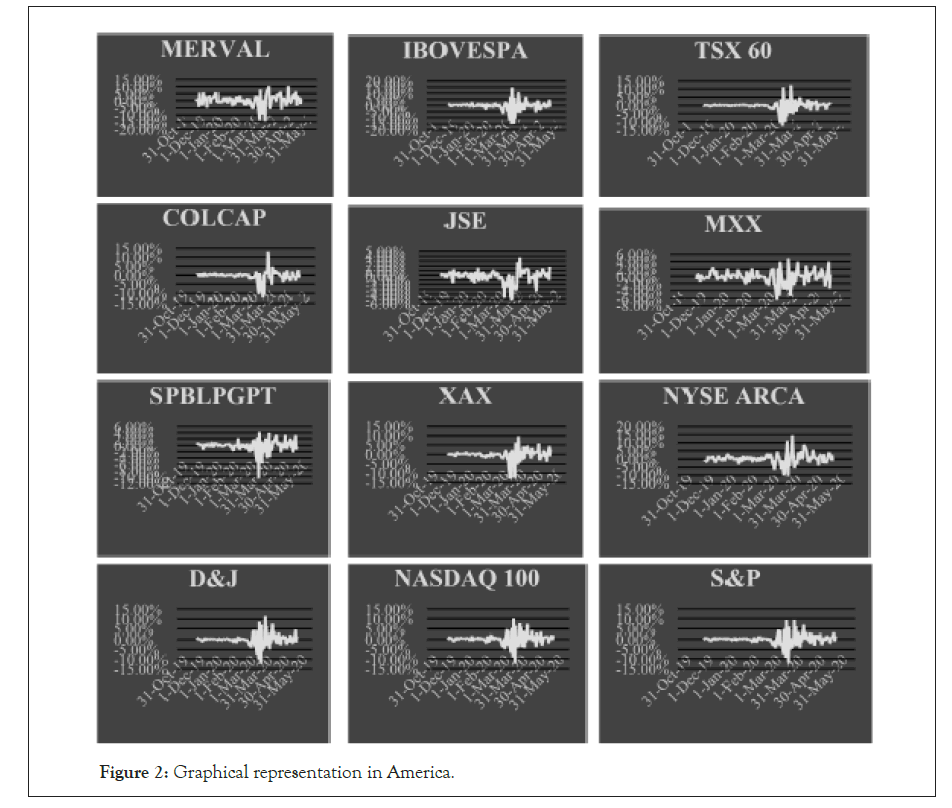
Figure 2: Graphical representation in America.
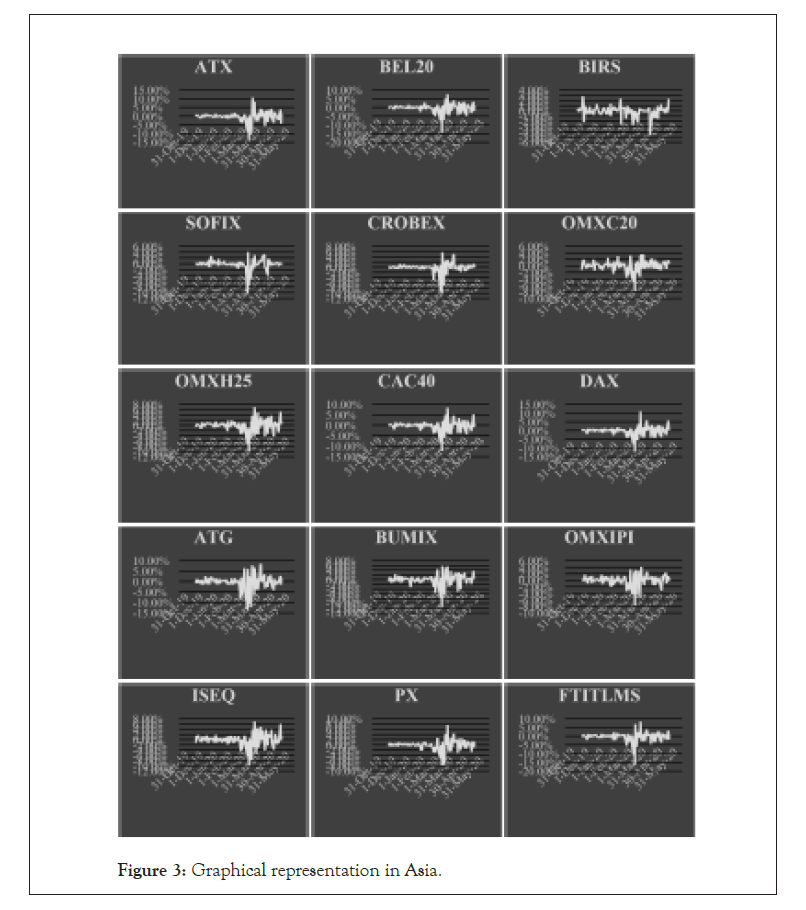
Figure 3: Graphical representation in Asia.
| Index | Country | Nov-Dec 2019 | Mean daily %change | Jan-May 2020 | Mean daily %change | COVID-19 infection count | Recovery rate (%) | Death rate (%) |
|---|---|---|---|---|---|---|---|---|
| NYSE Arca | United States | 905.69 | 0.31% | 962.82 | 0.30% | - | - | - |
| Nasdaq-10 0 | United States Argentina | 8,489.57 | 0.20% | 8,695.12 | 0.14% | - | - | - |
| MERVAL | 36,183.70 | 0.89% | 35,243.64 | 0.03% | 9,918 | 30% | 4% | |
| S&P 500 | United States | 3,166.46 | 0.14% | 2,964.54 | -0.04% | - | - | - |
| TSX 60 | Canada | 1,016.26 | -0.01% | 933.28 | -0.06% | 81,324 | 51% | 8% |
| Dow Jones (Composite) | United States | 9,253.19 | 0.09% | 8,344.31 | -0.12% | - | - | - |
| MXX | Mexico | 43,427.90 | 0.00% | 39,811.63 | -0.18% | 59,567 | 68% | 11% |
| XAX | United States | 2,475.60 | 0.18% | 2,045.04 | -0.23% | 16,20,902 | 24% | 6% |
| SPBLPGP T | Peru | 20,105.48 | 0.15% | 17,264.04 | -0.27% | 1,09,000 | 40% | 3% |
| IBOVESPA | Brazil | 1,11,693.35 | 0.35% | 94,731.39 | -0.28% | 3,10,000 | 41% | 6% |
Table 2: Recovery rate and death rate in the covid infected people in America.
| Index | Country | Nov-Dec 2019 | Mean daily %change | Jan-May 2020 | Mean daily %change | COVID-19 infection count | Recovery rate (%) | Death rate (%) |
|---|---|---|---|---|---|---|---|---|
| SZSE | China | 9,957.44 | 0.22% | 10,751.42 | 0.07% | 82,971 | 94% | 5.59% |
| KASE | Kazakhstan | 2,324.28 | 0.09% | 2,271.00 | -0.03% | 7,234 | 53% | 0.48% |
| KOSPI | South Korea | 2,137.71 | 0.13% | 1,989.02 | -0.08% | 11,142 | 91% | 2.37% |
| TWII | Taiwan | 11,786.46 | 0.11% | 10,908.57 | -0.09% | 441 | 92% | 1.59% |
| KLCI | Malaysia | 1,583.48 | -0.03% | 1,451.12 | -0.10% | 7059 | 82% | 1.61% |
| Hang Seng | Hong Kong CEI | 10,693.61 | 0.17% | 10,204.49 | -0.11% | 1,064 | 97% | 0.38% |
| VNI | Vietnam | 964.44 | -0.14% | 843.59 | -0.11% | 324 | 81% | 0% |
| Nikkei 225 | Japan | 23,565.23 | 0.08% | 20,998.93 | -0.13% | 16,518 | 77% | 4.84% |
| TA-35 | Israel | 1,684.05 | 1.66% | 1,512.78 | -0.14% | 16,670 | 82% | 1.66% |
| QSI | Qatar | 10,315.17 | 0.03% | 9,312.35 | -0.15% | 38,651 | 19% | 0.04% |
| TASI | Saudi Arabia | 8,117.08 | 0.14% | 7,294.41 | -0.15% | 65,077 | 55% | 0.54% |
| SET | Thailand | 1,575.93 | -0.04% | 1,352.35 | -0.15% | 3037 | 95% | 1.84% |
| MSM-30 | Oman | 3,990.70 | -0.10% | 3,785.49 | -0.16% | 6,370 | 29% | 0.47% |
| KSE100 | Pakistan | 40,079.24 | 0.25% | 36,513.84 | -0.16% | 50,694 | 30% | 2.10% |
| DS 30 | Bangladesh | 1,571.05 | -0.32% | 1,469.09 | -0.18% | - | - | - |
| FTSES | Singapore | 333.67 | 0.01% | 296.58 | -0.20% | 29,812 | 41% | 0.08% |
| ASE | Jordan | 1,801.45 | 0.04% | 1,800.50 | -0.23% | 684 | 67% | 1.32% |
| BSESN | India | 40,990.47 | 0.05% | 35,849.12 | -0.26% | 1,18,501 | 41% | 3.03% |
| PSEi | Philippines | 7,786.09 | -0.04% | 6,435.62 | -0.31% | 13,434 | 22% | 6.30% |
| IDX | Indonesia | 6,170.93 | 0.09% | 5,271.60 | -0.32% | 20,162 | 24% | 6.34% |
| CSE | Sri Lanka | 6,114.97 | -0.01% | 5,581.01 | -0.48% | 1,048 | 58% | 0.86% |
Table 3: Recovery rate and death rate in the covid infected people in Asia.
In Asia, SZSE (China) stands alone as the sole index sustaining a positive mean change in price of 0.07% from January to May 2020. Although it incurred a 0.15% decrease from 0.22% from November to December 2019 to 0.07% from January to May 2020 the Chinese government’s actions against the effects of COVID-19 to their economy prove to be effective. Considering that the first case and the first outbreak of the COVID-19 infection was recorded in the seafood market in Wuhan, the capital city of the Hubei Province. According to Johns Hopkins University (2020) as cited by Alhamadi et al. as early as March 2020, there were signs that the containment measures of China were producing effective results in reducing the number of new COVID-19 cases [2]. On the other hand, the World Bank projects that the Gross Domestic Product of China could grow as low as just 2.3% in 2020 as compared to the 6.1% growth in 2019 [1]. As the outbreak ravages other countries China’s economy will be much affected due to plummeting demands for Chinese exports including its rising tensions from other countries including Australia, Japan, and the United States. Australia’s decision to do an independent investigation regarding the origin of the virus drew negative reactions from China [2]. China’s Ambassador to Australia, Cheng Jingye, warned that this move by Australia could cause negative effects to the relationship of the two countries citing possible banning of Australian products. In Japan a 243.5 billion yen ($2.2 billion) stimulus package has been earmarked to help Japanese companies move out of China. This exodus will have a long term negative effect on China's economy. In the United States, the Trump administration is preparing a long- term plan on punishing China over what they believed as China’s taking advantage of the COVID-19 pandemic as a retaliatory ploy over the US-China trade war.
CSE (Sri Lanka) suffered the most loss in the Asia region losing 0.47% from -0.1% from November to December 2019 to -0.48% from January to May 2020 (Table 4) (Figure 4).
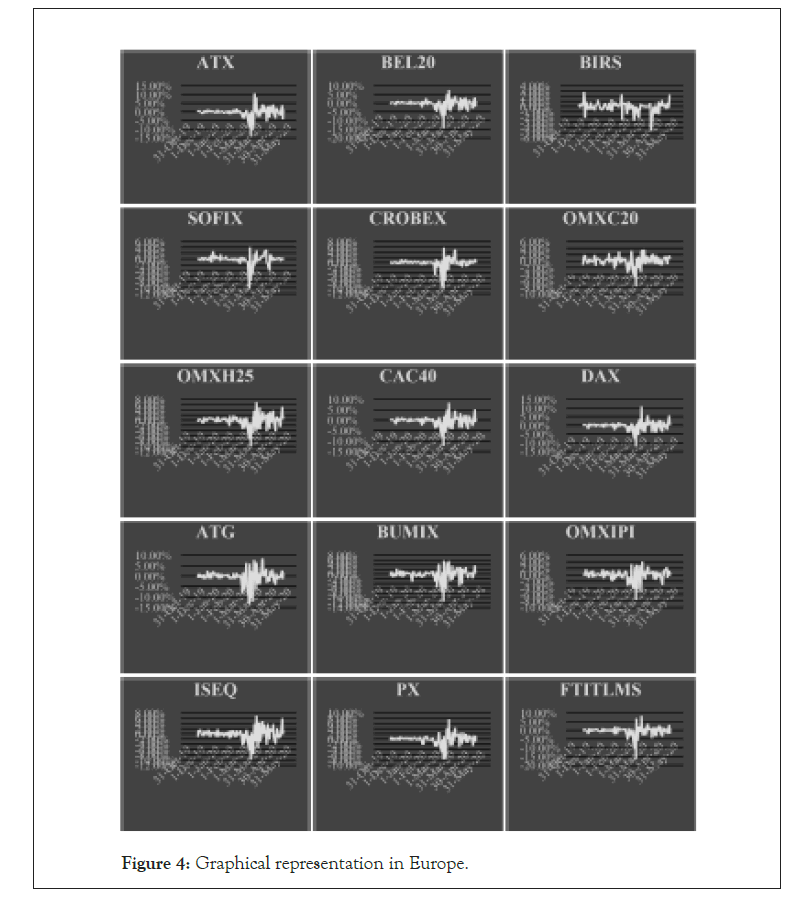
Figure 4: Graphical representation in Europe.
| Index | Country | Nov-Dec 2019 | Mean daily% change | Jan-May 2020 | Mean daily% change | COVID-19 infection count | Recovery rate (%) | Death rate (%) |
|---|---|---|---|---|---|---|---|---|
| OMXC20 | Denmark | 1,118.01 | 0.19% | 1,145.45 | 0.09% | 11,182 | 86% | 5.02% |
| SAX | Slovakia | 345.74 | 0.08% | 340.7 | -0.02% | 1,502 | 83% | 1.86% |
| PFTS | Ukraine | 511.67 | -0.06% | 512.54 | -0.02% | 20,148 | 33% | 2.92% |
| OMXIPI | Iceland | 1,498.20 | 0.16% | 1,408.33 | -0.03% | 1,803 | 99% | 0.55% |
| BIRS | Bosnia | 607.9 | 0.19% | 609.4 | -0.04% | 2,350 | 68% | 5.96% |
| MOEX | Russia | 2,971.57 | 0.13% | 2,780.28 | -0.07% | 3,35,882 | 32% | 3.14% |
| OMXH25 | Finland | 4,104.42 | 0.14% | 3,848.48 | -0.09% | 6,493 | 74% | 4.71% |
| AEX | Netherlands | 600.25 | 0.07% | 542.97 | -0.10% | 44,700 | - | 12.92% |
| OMXS30 | Sweden | 1,751.48 | 0.10% | 1,636.10 | -0.10% | 32,172 | 15% | 12.03% |
| DAX | Germany | 13,201.30 | 0.03% | 11,637.32 | -0.13% | 1,79,021 | 89% | 4.64% |
| OSEBX | Norway | 910.52 | 0.14% | 817.96 | -0.14% | 8,301 | 96% | 2.82% |
| BET | Romania | 9,877.15 | 0.10% | 8,889.83 | -0.15% | 17,585 | 60% | 6.57% |
| BELEX15 | Serbia | 774.7 | 0.17% | 731.71 | -0.18% | 10,919 | 49% | 2.17% |
| PSI-20 | Portugal | 5,180.69 | 0.00% | 4,615.35 | -0.19% | 29,912 | 22% | 4.27% |
| FTE100 | United Kingdom | 7,393.73 | 0.14% | 6,495.95 | -0.19% | 2,50,908 | - | 14.36% |
| ISEQ | Ireland | 7,067.51 | 0.20% | 6,089.64 | -0.21% | 24,391 | 86% | 6.49% |
| PX | Czech | 1,091.89 | 0.14% | 957.92 | -0.22% | 8,743 | 68% | 3.50% |
| CROBEX | Croatia | 2,000.44 | 0.05% | 1,751.46 | -0.23% | 2,237 | 88% | 4.34% |
| BUX | Hungary | 44,597.70 | 0.20% | 38,682.33 | -0.23% | 3,678 | 43% | 12.94% |
| SOFIX | Bulgaria | 548.46 | 0.13% | 502.78 | -0.24% | 2,331 | 31% | 5.15% |
| WIG20 | Poland | 2,127.38 | -0.08% | 1,800.81 | -0.24% | 20,143 | 42% | 4.83% |
| BEL20 | Belgium | 3931.57 | 0.06% | 3,430.34 | -0.25% | 56,235 | 27% | 16.34% |
| CAC40 | France | 5,914.07 | 0.05% | 5,105.70 | -0.25% | 1,44,000 | 44% | 19.59% |
| FTITLMS | Italy | 25,503.90 | 0.04% | 22,039.46 | -0.27% | 2,28,000 | 59% | 14.25% |
| IBEX 35 | Spain | 9,439.67 | 0.13% | 8,091.10 | -0.33% | 2,80,117 | 70% | 9.97% |
| ATX | Austria | 3,164.77 | 0.04% | 2,569.27 | -0.36% | 16,353 | 91% | 3.87% |
| ATG | Greece | 892.49 | 0.12% | 733.89 | -0.37% | 2,853 | 48% | 5.89% |
Table 4: Recovery rate and death rate in the covid infected people in Oceania.
In Europe only OMXC20 (Denmark) showed a positive mean change in price of 0.09% from January to May 2020. However, it suffered a decrease of 0.10% from 0.19% mean change in price from November to December 2019. The COVID-19 infection count of Denmark is 11,182 on May 20, 2020 with 86% recovery and a 5.02% death rate. The first COVID-19 case of the country occurred on February 27, 2020 when a journalist returned from abroad. Following the increase in infection the Danish government ordered the closure of educational institutions and banned public gatherings [3-5]. On March 14, the country closed its borders and allowed only Danish citizens and people with important agendas to enter the country. Stimulus packages to cover employees and employers were enacted to cover the losses brought about by reduced economic activity due to the pandemic. ATG (Greece) suffered the most loss in the European region sliding 0.25% from 0.12% from November to December 2019 to -0.37% from January to May 2020 (Table 5) (Figure 5).
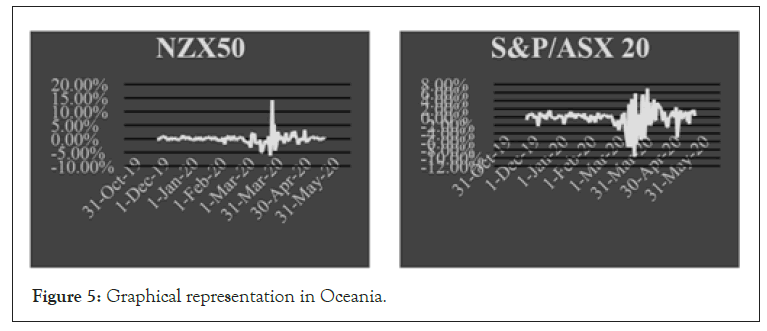
Figure 5: Graphical representation in Oceania.
| Index | Country | Nov-Dec 2019 | Mean daily% change | Jan-May 2020 | Mean daily% change | COVID-19 infection count | Recovery rate (%) | Death rate (%) |
|---|---|---|---|---|---|---|---|---|
| NZX 50 | New Zealand | 11,292.99 | 0.14% | 10,914.76 | -0.03% | 1,154 | - | 1.82% |
| S&P/ASX 20 | Australia | 6768.86 | -0.02% | 6,052.66 | -0.15% | 7,079 | 91% | 1.41% |
*Due to unavailability of data, Bangladesh is not included.
**Recovery rate for the Netherlands and United Kingdom are unavailable.
***New Zealand is excluded due to unavailability of data.
Table 5: Recovery rate and death rate in the covid infected people in Oceania.
In the Oceania region, both NZX 50 (New Zealand) and S and P/ ASX 20 (Australia) sustained mean change of -0.03% and -0.15% from January to May 2020 respectively. NZX 50 incurred a 0.11% decrease from 0.14% while SandP/ASX 20 observed a 0.13% decrease from November to December 2019 [6-8]. Australia and New Zealand registered 7,079 and 1,154 COVID-19 infections on May 20, 2020 which are significantly lower compared to other regions (Table 6).
| Region | November-December 2019 Mean daily% change | January-May 2020 mean daily% change | COVID-19 infection count | Mean recovery rate (%) | Mean death rate (%) |
|---|---|---|---|---|---|
| Africa | -0.02% | 0.11% | 40,343 | 43% | 4% |
| Asia | 0.11% | -0.17% | 490,893* | 61.50% | 2.07% |
| Europe | 0.11% | -0.17% | 17,41,959 | 60.12%** | 7.08% |
| Americas | 0.21% | -0.12% | 22,09,561 | 38% | 6% |
| Oceania | 0.06% | -0.09% | 8,233 | 91%*** | 1.62% |
Table 6: Comparison across Regions.
Table shows the comparison of relevant statistics across the regions (Table 6). Europe has the highest COVID-19 mean death rate of 7.08% followed by the Americas which has 6%. In terms of COVID-19 mean recovery rate, Oceana registered the highest at 91% while Asia and Europe at 61.50% and 60.12% respectively. The impact of COVID-19 to stock indices is mostly felt in Asia and Europe with both having a -0.17% mean change in daily prices from January to May 2020. Asian and European indices also suffered a 0.28% decrease in the mean change in daily prices as compared during November to December 2019. African indices on average stood to be the least affected with 0.11% mean change in daily prices as compared to -0.02% from November to December 2019 [9].
Table shows the Pearson correlation analysis between Mean Daily % Change in Price and COVID-19 infection count (Table 7). The p-value of 0.9129 shows that there is no sufficient evidence to conclude that stock indices are significantly affected by the COVID-19 infection count. That is, stock indices are not linearly associated with the COVID-19 infection count of a country. This result could be due to all countries implementing measures such as lockdowns, closure of non-essential businesses, and reducing economic activities to control or prevent the further increase in new infection regardless of having a low or a high infection count [10,11].
| COVID-19 infection count | Verbal interpretation | ||
|---|---|---|---|
| Mean Daily % Change in Price | Pearson’s r | 0.01 | |
| t-value | 10.99% | Not significant | |
| p-value | 0.91 |
Table 7: Pearson correlation.
Conclusion
This paper showed the impact of COVID-19 on the global stock indices. Although it failed to prove the existence of a significant relationship between the changes in the prices of indices and COVID-19 infection count it’s still able to show how indices across Africa, Asia, Europe, Americas, and Oceania reacted to the pandemic. Argentina’s MERVAL and Denmark’s OMXC20 are able to retain positive mean change in daily prices particularly due to the measures the governments of these countries employed. However, it could be too early to tell if these measures can endure the continuously growing cases of COVID-19 infections and the reduced economic activity brought about by lockdowns and closure of non-essential businesses. The developing conflict between the United States and China could also play a significant role in the future values of the indices across the region. Countries are now weighing the consequences of salvaging the economy and protecting the welfare of its citizens.
REFERENCES
- He Q, Liu J, Wang S, Yu J. The impact of COVID-19 on stock markets. Economic and Political Studies. 2020;8(3):275-288.
- Al-Awadhi AM, Al-Saifi K, Al-Awadhi A, Alhamadi S. Death and contagious infectious diseases: Impact of the COVID-19 virus on stock market returns. J Behav Exp Finance. 2020;27(1):100326.
- Buhagiar R, Cortis D, Newall PWS. Why do some soccer bettors lose more money than others?. Journal of Behavioral and Experimental Finance. 2018;18(2):85-93.
- Kowalewski O, Śpiewanowski P. Stock market response to potash mine disasters. Journal of Commodity Markets. 2020;20(1):100124.
- Chen CD, Chen CC, Tang WW, Huang BY. The positive and negative impacts of the SARS outbreak: A case of the Taiwan industries. The Journal of Developing Areas. 2009;43(1):281-293.
- Ichev R, Marinč M. Stock prices and geographic proximity of information: Evidence from the Ebola outbreak. International Review of Financial Analysis. 2018;56(1):153-166.
- Wagner, A.F. What the stock market tells us about the post-COVID-19 world. Nat Hum Behav. 2020;4(5):440.
- Ashraf BN. Stock Markets’ Reaction to COVID-19: Moderating Role of National Culture. SSRN.
- Kizys, R., Tzouvanas, P., Donadelli, M. (2020). From COVID-19 herd immunity to investor herding in international stock markets: The role of government and regulatory restrictions. International Review of Final Analysis. 2021;74(2):101663.
- Baker S, Bloom N, Davis SJ, Kost K, Sammon M, Viratyosin T. The unprecedented stock market reaction to COVID-19. Covid Economics: Vetted and Real-Time Papers. 2020;1(3):26945.
- Ramelli S, Wagner AF. Feverish stock price reactions to COVID-19. The Review of Corporate Finance Studies. 2020;7(1):cfaa012.
Citation: Balilla J (2021) Characterizing the Impact of COVID-19 on the Global Stock Indices through Comparative Analysis. J Bacteriol Parasitol. S10: 005.
Copyright: © 2021 Balilla J. This is an open-access article distributed under the terms of the Creative Commons Attribution License, which permits unrestricted use, distribution, and reproduction in any medium, provided the original author and source are credited
