
Indexed In
- Genamics JournalSeek
- JournalTOCs
- CiteFactor
- RefSeek
- Hamdard University
- EBSCO A-Z
- OCLC- WorldCat
- Publons
- Google Scholar
Useful Links
Share This Page
Journal Flyer
Open Access Journals
- Agri and Aquaculture
- Biochemistry
- Bioinformatics & Systems Biology
- Business & Management
- Chemistry
- Clinical Sciences
- Engineering
- Food & Nutrition
- General Science
- Genetics & Molecular Biology
- Immunology & Microbiology
- Medical Sciences
- Neuroscience & Psychology
- Nursing & Health Care
- Pharmaceutical Sciences
Research Article - (2019) Volume 8, Issue 1
Analysis of Torsional Stiffness of the Frame of a Formula Student Vehicle
David Krzikalla*, Jakub Mesicek, Jana Petru, Ales Sliva and Jakub SmirausReceived: 25-Sep-2018 Published: 07-Jan-2019, DOI: 10.35248/2168-9873.19.8.315
Abstract
This paper presents an analysis of the torsional stiffness of the frame of the Formula TU Ostrava team vehicle Vector 04. The first part introduces the Formula SAE project and the importance of torsional stiffness in frame structures. The paper continues with a description of the testing method used to determine torsional stiffness and an explanation of the experimental testing procedure. The testing method consists of attaching the frame with suspension to two beams. A force is applied to one of the beams, causing a torsional load on the frame. From displacements of certain nodes of the frame, overall and sectional torsion stiffness is then determined. Based on the experiment, an FEM simulation model was created and refined. Simplifications to the simulation model are discussed, and boundary conditions are applied to allow the results to be compared with the experiment for verification and the simulation to be tuned. The results of the simulation and experiment are compared and com-pared with the roll stiffness of suspension. The final part of the paper presents a conclusion section where the results are discussed.
Keywords
Torsional stiffness; Frame; Formula student; Formula SAE; Experiment
Introduction
Formula SAE is an engineering competition for university students conducted by the SAE International Organization (formerly the Society of Automobile Engineers), which brings together professionals from the transport, automotive, aerospace and commercial vehicles industries.
Over the years, three vehicle categories have emerged:
• Combustion vehicles – Vehicles powered by 4-stroke combustion engine.
• Electric vehicles – Vehicles powered by electric motors.
• Driver-less vehicles – Autonomous vehicles powered by either combustion or electric power-train.
The objective of Formula SAE is to design a racing car according to official rules, test the car before competition for possible issues and then race it in the competition. Since an integral part of the competition is static disciplines and requires a team to demonstrate understanding of car design and business thinking, Formula SAE is not simply about racing but mainly about development, research and the improvement and application of knowledge in real technical situations. Sometimes, the race for first place can be very intense. To avoid dangerous situations arising from risky car design, each team must design the car according to official rules to satisfy safety requirements. The key property of a vehicle’s frame is its longitudinal torsional stiffness (Figure 1). It means the resistance to twisting along the longitudinal axis while cornering or as a wheel travels over a bump. If the frame is not rigid enough, the suspension will not function correctly. Because of this, torsional stiffness affects the vehicle’s performance and behaviour significantly [1,2].

Figure 1: Longitudinal torsional mode [1].
Teams evaluate the torsional stiffness of the frame to determine the design’s quality and find out whether the frame is rigid enough compared to the roll stiffness of the suspension. Torsional stiffness is a suitable property for the comparison of frames. The ratio between frame stiffness and its mass can also help with optimizing the frame. The drawback of this ratio is that it can be little confusing. If one imagines a very stiff (significantly exceeding the roll stiffness of the suspension) but very heavy frame, then the ratio is high, but the vehicle’s performance suffers from the great mass of the frame. The team must find an adequate frame design that is as stiff and lightweight as possible.
In general, torsional stiffness of the frame should be higher than roll stiffness. Torsional stiffness of the frame has no fixed value with respect to the roll stiffness of the suspension, which should be exceeded. The more sources one looks for, the more recommendations one can find [2-5]. According to these sources, torsional stiffness should be two to ten times greater than the roll stiffness of the suspension. For most Formula SAE cars, it is sufficient for the frame to be four times stiffer than the suspension [2]. Other possibilities for examining frame properties are introduced, for example, by Caddemi et al. [6].
Methodology and Experiment
Gender and biological age
For testing, a procedure with two beams was used. One axle was fixed to a rigid beam and the second axle was attached to another beam that could rotate about the longitudinal axis of the frame. A load was applied to one side of the rotating beam, resulting in torque. As the frame twisted, displacement of the frame was measured. From the displacement, the torsional stiffness was calculated as the ratio between the applied torque and the deformation angle. The testing setup is shown in Figure 2. The advantage of this procedure was its easy attainability. Its drawback was that the frame was loaded in quite an artificial manner (the frame would not be loaded in this way as the vehicle races around a track).

Figure 2: Testing setup.
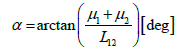
As the weight was applied, the rotating beam moved by a certain angle and the corresponding vertical displacement μ1 and μ2 could be measured (horizontal displacement was neglected in this case because of its negligible influence in the change of dimension L12, which is affected by rotation).
From the deformation triangle in Figures 3 and 4, the angle α is determined as follows:

Figure 3: Simplified front view of rotating beam.

Figure 4: Deformation triangle.
 (1)
(1)
where L12 is the pitch of points 1 and 2.
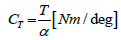
Torsional stiffness CT is calculated as the ratio between applied torque T and the angle of deformation α.
 (2)
(2)
 (3)
(3)
where F is the force caused by the applied mass and L is the length from the point of the force to the point of rotation (Figure 3).
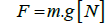
(4)
where m is mass of the applied weight and g is gravity acceleration, which equals 9.81 m/s2.
Experiment
As mentioned above, a testing procedure with two beams was used, one fixed and the second allowed to rotate. Both beams consisted of square steel profiles with cross-sectional dimensions of 100 × 100 × 4 mm and holders for the frame.
Testing was performed according to the testing model in Figure 2 with one change. Steel rods (Figure 5) were fitted instead of spring dampers to provide locked suspension (the torsional stiffness of the frame would be affected by the stiffness of the springs and the results would be inaccurate).

Figure 5: Rod replacing dampers.
The final testing setup with the Vector 04 vehicle frame attached to the testing beams is shown in Figure 6. For the experiment, a frame with an ARB suspension system was used. Displacement was measured at six points (Figure 7) with dial indicators during torque loading of the frame as the mass was applied to the front beam.

Figure 6: Experimental setup.

Figure 7: Measured points.
The measurements were carried out three times. Displacement was measured each time mass was incrementally added or removed. At each step (ten steps in total), a certain mass was added (or removed). The maximum applied mass (at the tenth loading step) was 56.2 kg.
The values of displacement at points 1 and 2 were applied to the calculation described above. Calculation provided 60 values of stiffness. The values were statistically processed and a final value for torsional stiffness of the frame was determined. The sectional stiffness of the frame was determined in a similar manner (using displacements at points 4 to 6). Sectional stiffness is important, because if one imagine the frame as a system of springs in series, the system is thus only as stiff as its weakest spring. The results are given in section 4.
FEM Simulation
Based on the experiment, an FEM simulation model was created and simulated in Ansys software. In an ideal case, the simulation gives the same results as the experiment and thus eliminates the need for the designer to perform a new and time-consuming experiment for each design iteration by using only a relatively fast simulation.
Simulation model
The simulation model was created from line bodies with assigned cross-sections. The frame structure was imported as a wire-frame model, but all other parts such as suspension and testing beams were created manually. Due to the complexity of suspension components and line-body modelling, components were simplified into line-bodies with approximate assigned cross-sections. Components with a higher likelihood of importance to the results (uprights) were simulated for their stiffness (force causing a deformation of 1 mm) and a substitute cross-section was calculated. The final simulation model is shown in Figures 8 and 9 below.

Figure 8: Final mesh (20 mm/element).

Figure 9: Boundary conditions.
As suspension components are connected to each other and the frame via various bearings, the joints between them were applied to ensure as realistic behaviour as possible (ideal joints were used friction was not considered). The materials properties are shown in Tables 1 and 2. Carbon fibre material is considered as isotropic in this simulation, given by Young’s modulus (value of the compression test of one suspension tube) and Poisson’s ratio (set as approximate value). Sensitivity analysis and results compared to the experiment confirm that such formulation of carbon fibre material is acceptable for this kind of simulation.
| Step | 1 | 2 | 3 | 4 | 5 | 6 | 7 | 8 | 9 | 10 |
| Mass [kg] | 5 | 9.7 | 5.2 | 5.2 | 5 | 4.9 | 5 | 5 | 5.6 | 5.6 |
Table 1: Loading steps and mass added.
| Material | Young’s modulus [MPa] | Poisson’s ratio [-] |
|---|---|---|
| Steel | 200 000 | 0.3 |
| Carbon fibre tube | 12 280 | 0.3 [4] |
| Aluminium AW 7022 | 72 000 | 0.34 |
| Aluminium AW 7075 | 71 000 | 0.34 |
| Plastic Igumid G | 8000 | 0.3 |
Table 2: Material properties used.
Since the model was created from line bodies, beam elements were used (BEAM188 in Ansys). Due to the joints and remote boundary conditions, so-called MPCs were used (in Ansys MPC184). A mesh was created in Ansys Mechanical with an element size of 20 mm/element. Sensitivity analysis confirms this mesh setup as enough. The mesh has 5238 nodes in 2638 elements.
Boundary conditions were set in accordance with the experimental setup. The rear beam was fixed (Fixed support) and the front beam could rotate about longitudinal axis of the frame (use of Remote displacement), with a force applied at the end of the front beam (Force). The Force was set in a table, and thus displacements at each loading step were determined in one simulation.
The simulation was performed for a model with and without an anti-roll bar (ARB). Because geometric non-linearity occurred (large deflection of the end of front beam approx. 16 mm), the simulation was performed linearly and nonlinearly, respectively.
Results and Discussion
Table 3 below shows the results of the overall torsional stiffness of the frame from both the experiment and simulation. The difference between the results of simulation and the experiment is also shown. The experimental result is the average value of all measurements (60 in total) with an uncertainty of 6.1 Nm/deg (approx. 1% of result).
| Variable | Overall torsional stiffness [Nm/deg] | Difference [%] |
|---|---|---|
| Linear-No ARB | 645.5 | -- |
| Linear-With ARB | 753 | 14.3 |
| Non-linear-No ARB | 640.6 | -- |
| Non-linear-With ARB | 752 | 14.8 |
Table 3: Overall comparison of results.
From Tables 4 and 5 below, the problem can be solved as a linear simulation model (large deflection non-linearity can be neglected), because the difference of results between the linear and non-linear model is up to 1%.
| Variable | Overall torsional stiffness [Nm/deg] | Difference [%] |
|---|---|---|
| Linear-No ARB | 645.5 | -- |
| Non-linear-No ARB | 640.6 | -0.8 |
| Linear-With ARB | 753 | -- |
| Non-linear-With ARB | 752 | -0.1 |
Table 4: Influence of ARB on torsional stiffness.
| Variable | Overall torsional stiffness [Nm/deg] | Difference [%] |
|---|---|---|
| Linear-No ARB | 645.5 | -- |
| Non-linear-No ARB | 640.6 | -0.8 |
| Linear-With ARB | 753 | -- |
| Non-linear-With ARB | 752 | -0.1 |
Table 5: Influence of non-linear simulation model.
Figure 10 depicts from all simulation models a comparison of the deformation angle α along the frame with the deformation angle from the experimental measurements. The smooth curves display the results from simulations and the straight-line curve displays the results from the experiment. The blue and grey curves are barely visible as they closely follow the orange and yellow curves, respectively. This demonstrates the proximity of the results.

Figure 10: Comparison of deformation angle alpha along the frame.
Comparison with the roll stiffness of the suspension
The value of torsional stiffness is useless if it cannot be compared with anything. Torsional stiffness is usually com-pared with the roll stiffness of the suspension. As the vehicle has two axles and each can have a different roll stiffness (roll stiffness is calculated for only 1 axle), the total roll stiffness of suspension was determined as follows.
First, roll stiffness of the individual axles was calculated (Table 6). We can then imagine the front axle – frame – rear axle structure as system of springs connected in series. This is depicted in Figure 11 below.

Figure 11: Depiction of frame/suspension connected as springs.
| Roll stiffness [Nm/deg] | |
| Front axle | 599 |
| Rear axle | 456 |
Table 6: Table of roll stiffness of individual axles.
The front and rear axles have roll stiffness, but the frame is considered as rigid. The total roll stiffness is then calculated:
According to the formula for the total stiffness of a system of springs in series. Thus, total roll stiffness CR:
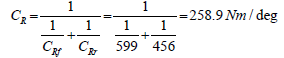 (5)
(5)
Where CRf is roll stiffness of the front axle and CRr is roll stiffness of the rear axle.
Finally, the torsional stiffness/roll stiffness ratio CTR:
 (6)
(6)
Where CT is the torsional stiffness of the frame.
Table 6 shows the results of torsional stiffness/roll stiffness ratio for experimental and simulated results.
Conclusion
The results show that it is possible to build an FEM simulation model to simulate the torsional stiffness of frame structures which provides good results with respect to the experiment (a resulting difference of up to 10% is acceptable) despite simplifications (materials, geometry). The results also show the importance of an ARB in the model during simulation of the torsional stiffness of the frame and the negligibility of so-called “large deformation” non-linearity. This simulation model is useful for designing frame structures without the need to perform experimental testing of stiffness for each design iteration, which would involve producing each design iteration and the time-consuming process of testing. Simulation also provides insight into not only the overall frame stiffness, but also sectional stiffness, which is even more important for the effective design of frames with a good, balanced weight/stiffness ratio.
Acknowledgement
This article was written in connection with the project Education system for personal research and development in the field of modern trends in surface engineering – surface integrity, reg. no. CZ.1.07/2.3.00/20.0037 financed by the Structural Funds of the European Union, the state budget of the Czech Republic and the project Student Grant Com-petition SP2018/150 and SP2018/136 financed by the Ministry of Education, Youth and Sports and Faculty of Mechanical Engineering VŠB-TUO.
REFERENCES
- Riley WB, George AR. Design, analysis and testing of a formula SAE car chassis. SAE Tech Pap. 2002;2:1.
- Van K, Janis DG. Design of a formula student race car chassis. 2008;pp:1-84.
- Hladík O. Návrh prostorového trubkového rámu vozu kategorie. 2015;pp:1-44.
- Tulis V. Vliv smáru vláken dlouhovláknového kompozitu v okolí díry na napětí. 2016;pp:1-55.
- Mrkvica I, Sleha V, Petru J, Neslusan M, Jurko J. Design of control jig for inserts measurement. In: Manufacturing Technology. 2016;16:198-204.
- Caddemi S, Calio I, Cannizzaro F. The dynamic stiffness matrix (DSM) of axially loaded multi-cracked frames. Mech Res Commun. 2017;4:90-97.
Citation: Krzikalla D, Mesicek J, Petru J, Sliva A, Smiraus J (2019) Analysis of Torsional Stiffness of the Frame of a Formula Student Vehicle. J Appl Mech Eng 8: 315. doi: 10.35248/2168-9873.19.8.315
Copyright: © 2019 Krzikalla D, et al. This is an open access article distributed under the term of the Creative Commons Attribution License, which permits unrestricted use, distribution, and reproduction in any medium, provided the original author and source are credited.