Research Article - (2020) Volume 8, Issue 2
Instruments of meteorological data collection in the mountain are mostly stationed either on hillsides or in valleys. The data cannot well represent the state of climatic changes in transitional agro-ecological belts in the surroundings. Moreover, the human’s stresses experienced from climatic changes are outcomes of interactions of many abiotic and biotic factors, and cannot be well assessed with the instrumental data. The social science-based study is considered a supporting approach to address the instrumental data problem. Previous social science studies consist of many anomalies in research design, data collection, and analysis, intertation. The weaknesses in those studies are primarily caused by a lack of well-developed theoretical models. To address the methodological problem, this study proposed and illustrated “The Random Experience Model”, a pioneer theoretical framework in climate change study. Applicability of the theoretical framework is demonstrated in a pilot study. A few points worth considering in future studies for demonstrating the strengths of the model are listed.
Exposure; Extreme-weathers; Mountain; Nepal; Theoretical model; Random-experience
Mountain topography has resulted in distributional variation of local climate (e.g., temperature, air pressure, wind, humidity, fog, hailstorms, and precipitation) in season and space which can be observed even between narrow geographical spaces [1,2]. However, instruments and facilities to record weather patterns or climate changes in the mountain are stationed mostly in valleys or on ridges. Their data cannot be considered always well representative of diverse agro-ecological regions and transitional belts in the surrounding [2-4]. The instrumental data are also not available in many localities, particularly in developing societies. The data from the available facilities have been also affected by many sources of problems. The information based on the data cannot be robust to make policy decisions for socially and environmentally vulnerable societies. The problems include instrumental faults, recording errors, inadequate observations, and missing records. Other issues include standardization flaws (e.g., averaging daily data into weekly, monthly, or yearly figure) and local influences (e.g. dynamic of landuse change). The homogenization approach also has limitations in correcting localized historical problems in the data with few records [5,6]. The errors associated with the problems can make big differences in the results because the climate changes have been mostly determined by fraction changes in the measurement unit. Conflicting findings of climate change studies are potentially associated with data problems [3,7]. Also, the records of most stations are limited to rainfall and temperature dynamics, but other climatic factors (e.g. fog, hailstorm, and humidity) are also important for policy decisions and particularly on adaptation measures.
Moreover, human belief and policy decisions on climate change are determined more by human perceptions and experiences. In such a situation, decision-makers require information about the human dimension to devise adaptation measures appropriate for local communities. Information from the instrumental data may not be enough to explain the human stresses experienced from emerging climate change. Experimental studies show that some climatic factors interact with biotic and abiotic factors and result in people’s feeling noticeably different from instrumental records. For example, hotness feeling (measured in human-perceived equivalent temperature) of people depends on the combination levels of temperature, humidity, and airflow factors [8-11]. The interpretation of the human feeling of the hotness feeling can be misleading. Information from alternative sources may help decisionmakers in such complicated conditions [12]. Essentially, multiple sources of information would give deeper insights regarding the mechanisms of climate change and increase decision making confidence about escalated climate change [4,12]. Social sciencebased studies collect information on real-life human observations and experiences (community-based knowledge) about climate change and alleviate the problems associated with instrument data of weather and climate pattern changes [4,12,13].
Despite the growing number of social science studies on climate change, there are a lot of anomalies in data collection and analysis for drawing valid conclusions [4,12-19]. One of the problems in the previous studies is attempting to examine the state of climate change on the human perception that can be determined by many bias inherited factors [20-22]. The information based on experience can be considered much more precise than that of perception because the experiences are based on real-life feelings unless distorted by illusion or hallucination. Previous studies on climate change have not been designed around the principle or theory of experience. A primary cause of missing the valid source is the lack of an established theoretical framework that would provide the conceptual basis of the study phenomena, guide research designs, and analyze data in a proper track. Applications of well-established frameworks (e.g. the random utility model, general equilibrium model, or demand and supply model) have reduced such anomalies and simplify research works in the economic field. Climate policy scholars may ask whether the climatic change field can have any theoretical framework similar to the economic field.
The purpose of this work is to elicit and demonstrate the application of a theoretical framework that can guide social studies on climate change. This study has proposed a random experience model that considers climate phenomena and science better and alleviates the problems of previous studies. This approach, to the best of my knowledge, has not been illustrated and applied to the climate change field. The approach is expected to be useful specifically for identifying the principal variables for detecting climate change at the community level and reducing ambiguity and the cost of future studies. Psychosocial variables (attitude and media effect) can be used in the model to control non-experiential biases. The work, thus, contributes to the advancement of climate research methodology and knowledge. The study is based on the assumption that a social science method provides more useful information than the extrapolation approach for mountain communities where other instrument-based information is sparse or not available to determine local climate changes. The information in this approach applies only to the climate changes that humans can detect through their senses or exposure in biophysical work environments. The organization of the paper, henceforth, is similar to the primary data-based research articles.
An experience theory
People make many decisions based on information and knowledge of experiences. The principles of gaining experience-based information and knowledge are often termed experience theory. The theory is applied in the education and learning field to some extent [23]. It is used to make an understanding of how people gain information or knowledge based on real-life experiences. An individual gains knowledge by comparing feelings about a subject between two or more times, spaces, or other social or environmental conditions [23]. Experience learning consists of many elements: people, social environment, mutual interactions between people and the environment, and effects. For an educational objective, participants purposively involve in experiencing environments or activities and gain knowledge. The approach can be better termed as experiential learning theory [24]. Studies in the building industry and health sector also practiced the experiential learning approach. They studied human responses to changes in the states of some environmental factors such as temperature, humidity, and airflow [25,26]. The methodological approach of experiential learning, for example, followed in the building industry to study people’s comfortable feeling in different states of living environmental factors, can not be considered scientifically appropriate to apply to the climate change problem. It is because learning is a purposive and intentional activity that can be managed in a short time [25,26]. The climate change experiencing is unintentionally and passively gained which requires an interface with real-life physical environment usually for a long period. People may have gained physical, mental, emotional, spiritual, vicarious, and virtual experiences [24]. Climate change study concerns mainly on first-hand physical experience which is gained through personal observations and experiences. The life experience-based information can be considered more precise than the information obtained from secondary or tertiary sources.
Some scholars argue that people have limited memory and cannot remember past weather after a long period [19,27]. They hesitate to trust people’s experience-based information [27,28]. Some studies showed consistencies of the weather pattern changes between human experiences and meteorological records [29-31]. Individuals acquire knowledge or information based on their senses as they pass from one climate state to others during their lives [27]. People might remember the climate conditions of the past if the weather phenomena had attached to significant moments in their life. The information can be collected and used with appropriate research techniques.
Previous studies are primarily founded on the perception of people [21,29,32-34]. The perception is more likely determined by the social and political backgrounds of the people. In research designing and data collection, these studies gave more weights on the perception side and less on the experience side. If they had followed experience theory they would improve their research designing and data collection.
A random experience model
Societies consider climate change when community members repetitively experience that state of any weather pattern that is relatively unusual compare with the experience in their lives. Community members generally confirm the unusual condition by consulting or listening to memories of senior citizens in the communities. If individual i, experiences Skt-n state climatic factor in previous years and Skt+n state in recent years, the state change can be called climate change. Therefore, the probability, π, of individual i, experiencing a change of climate state k is the probability of the difference between the climatic states in the two different periods, namely t+n and t-n:

Where ‘t’ is the reference time and n refers to the period of the particular climatic state different from the reference time. The shift from one state to the other is the necessary condition for the probability of experiencing climate change. The condition is not sufficient because individuals of not all mountain communities might have experienced the change. People have lived and work at different elevations and, thus, they might experience different levels of climate change exposure. Global climate change has increased the elevations of freezing and melting levels which might have noticeably reduced intense hailstorm frequencies in lower elevation communities [35,36]. The probability of experiencing fewer hail storms is higher for individuals living at lower elevations. The leveling of atmospheric temperature alters the amount and period of heat radiation from the land. This radiation can affect fog development, especially in winter. The probability of an increased number of foggy days experienced by people might depend on how the radiation interacts with other spatial factors such as being inland or near the coast.
Also, an individual should be exposed to a condition for some years to experience at least two different environmental states. An individual involved in particular climate factor-related activities is also likely to notice a change in the natural environment. The changed factor might have affected their business which makes him or her experience environmental change. Individuals experiencing different climate factors were from the same population. Experiencing a change of one climate state might be linked with the experience of others, but a researcher could not observe the relationships. Accounting for the unobserved relationships in the model could improve the predictive quality of the estimates. Therefore, the probability of experiencing climate factor changes is the function of individual attributes, location factors, and unobserved relationships. (Equation 1) requires rewriting to include the conditions as follows:

Where x refers to the explanatory variables and Σto unobserved relationships of experiencing the difference of climatic variables.
Empirical method
Following the econometrics literature, the binary observed a problem with k (k= foggier, chillier, hotter, more rainfall, and fewer hailstorms) climate states can be illustrated as follows:
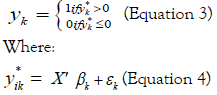
Here,  is a common statistical notation referring to the probability
of i individuals experiencing k climate states or
is a common statistical notation referring to the probability
of i individuals experiencing k climate states or 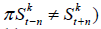 The
model has k number of binary dependent variable equations. The
term is popularly called the latent variable as it is determined by
explanatory variables in the x matrix with a multivariate normal
distribution error term (εk= N(0, Σ)). X' is a matrix of J explanatory
variables and βk is a coefficient matrix. One other requirement is
i≠J Here, the term Σ refers to the k x k matrix of contemporaneous
correlation of error terms of k climate models. Consideration of
the potential correlation of error terms of individual equations
in the estimation helps to improve the efficiency level of the
estimates. The seemingly unrelated multivariate (multinomial)
probit method is an appropriate method to analyze multivariate
problems with discrete measurements and unobserved correlations [37]. The model can be estimated by the full information maximum
likelihood method with the GHK simulator. The log-likelihood of
the multinomial probit model can be calculated as follows:
The
model has k number of binary dependent variable equations. The
term is popularly called the latent variable as it is determined by
explanatory variables in the x matrix with a multivariate normal
distribution error term (εk= N(0, Σ)). X' is a matrix of J explanatory
variables and βk is a coefficient matrix. One other requirement is
i≠J Here, the term Σ refers to the k x k matrix of contemporaneous
correlation of error terms of k climate models. Consideration of
the potential correlation of error terms of individual equations
in the estimation helps to improve the efficiency level of the
estimates. The seemingly unrelated multivariate (multinomial)
probit method is an appropriate method to analyze multivariate
problems with discrete measurements and unobserved correlations [37]. The model can be estimated by the full information maximum
likelihood method with the GHK simulator. The log-likelihood of
the multinomial probit model can be calculated as follows:
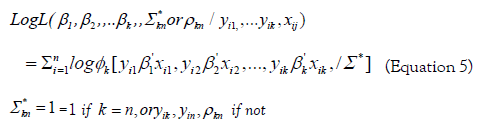
Where φ is the cumulative distribution function of the multivariate normal distribution. Similarly, yi1,...yik in the log-likelihood function are observed variables being equal to one or zero.
Equation 4 refers to the probabilities of experiencing a change in the states of k climate factors. The probability depends on both predictive and systemic (the first term on right-hand side of the equation) and stochastic (the second term in the right-hand side of the equation) components. The weights of the elements in the predictive component also depend on the chances of the sample distribution which cannot be directly observed. Therefore, the analytical framework can be called the climate change random experience model. The theoretical concept is similar to the random utility model that is popularly used to study choice decision problems in economics.
The study was carried out in three Nepalese hilly districts: Gorkha (28.4764°N, 84.6897°E), Lamjung (28.2765°N, 84.3542°E) and Sindhupal chok (27.9512°N, 85.6846°E). The districts can be classified, respectively, into lower-hill, mid-hill, and high hill. The lower hill communities lie between 440 m and 470 m, mid-hill between760 m and 1060 m and high-hill between 1150 m to 1530 m above sea level.
Lower-hill communities live on land with moderate slopes adjacent to a river. High-hill communities live mostly on hillsides and farm high slope terrains with a relatively wide elevation range. The probabilities of rainfall and hailstorm incidents are relatively higher in the high-hill belt than the others. Snowfall often occurs in the high-hill areas in winter. Mid-hill communities live and farm mostly in hills with some households in the foothills. The aspect of high-hill and mid-hill communities was mostly south-facing whereas low-hill communities were slightly west facing.
This study is based on social survey data. A face to face interview was administered to household heads who could generally be the oldest person in the family. If the household head was not available, then asked the second person. An elevation factor was believed to be a key determinant of climate change which guided the stratified study sampling. An equal number of samples were selected from each geographical strata. A random sampling approach was followed within each stratum. The survey questionnaire was developed in the structured model and pre-tested. Respondents were asked whether they had experienced unusual changes in local weather patterns in their lives. The surveys of 300 households were usable for analysis. The survey was conducted between February to April.
This study could not validate the social survey result with the instrumental data-based results because the study communities had no historical data from meteorological facilities. Some studies extrapolated information from neighboring metrological stations based on the difference in altitude between survey communities and meteorological stations and validated the social survey results [30,38]. The extrapolated data could not be reliable for validation of the results because many factors (e.g. aspect and wind direction) in addition to altitude determine the temperature difference between mountain locations [2,39]. However, the trends were consistent with the instrumental data nearby stations [30].
The respondents were asked whether foggier weather increased in winter had a yes/no option. The questions of a hailstorm, hotness, and coldness condition changes were structured as ‘increased’, ‘decreased’, or ‘no change’ options. The descriptive statistics of the data and the definitions of the variables are summarised in Table 1. The figures of mean ratios of the dependent variables are given at the bottom of the table.
| Variables and Definition | MeasurementUnit | Mean | Standard Deviation | Minimum | Maximum |
|---|---|---|---|---|---|
| HH Age=Household head age | Year | 49.18 | 11.88 | 23 | 83 |
| Area Log=Natural log of landholding (ropani) | Log | 7.733 | 0.771 | 5.521 | 9.159 |
| Animal head=Animal headcount* | No. | 4.241 | 2.549 | 0 | 11 |
| High-hill=Respondent living in high-hill(Yes=1, else=0) | Binary | 0.333 | 0.472 | 0 | 1 |
| Mid-hill=Respondent living in mid-hill (Yes=1, else=0) | Binary | 0.333 | 0.472 | 0 | 1 |
| Low-hill=Respondent living in low-hill (Yes=1, else=0) | Binary | 0.333 | 0.472 | 0 | 1 |
| Foggier= Increased foggier weather days in winterseason (Yes=1, else=0) | Binary | 0.34 | 0 | 1 | |
| Chillier=Increased colder weather(Yes =1, else =0) | Binary | 0.457 | 0 | 1 | |
| Hotter=Increased hotter weather (Yes=1, else=0) | Binary | 0.463 | 0 | 1 | |
| Rain=Rainfall increased (Yes=1, else=0) | Binary | 0.477 | 0 | 1 | |
| Hail=Hailstorm decrease(Yes=1, else=0) | Binary | 0.556 | 0 | 1 | |
| Poor=Self-reported poor household (Yes=1, else=0) | Binary | 0.393 | 0 | 1 | |
| Influential=Bahun, Chhetri and Bhujel ethnic groups(Yes=1, else=0) | Binary | 0.48 | 0 | 1 |
Note: Animal head measure fitted better than animal unit measure
Table 1: Descriptive statistics of the variables investigated.
The data of all dependent variables under study were sourced from the same population. Therefore, the coefficients of the model were estimated in the multivariate model (solved all equations simultaneously) with the Full Information Maximum Likelihood (FIML) method on M-plus software. The estimation approach is often called structural equation modeling which uses all available information in the model system and makes more precise estimation [37]. Following econometric literature, the data of the variables were preliminarily diagnosed with univariate models and evaluated with forwarding and backward variable deletion approach [37]. Redundant variables are restricted in the model to increase explaining the power of the significant variables. Table 2 shows the results of the multivariate model by restricting redundant variables. The signs of the coefficients are also according to expectation. All the variables included in the models are relevant to the trap experience of climate change (Table 2). The results, therefore, are methodologically valid.
| Climate | Variable | Coefficient | Std error | z-value | p-value |
|---|---|---|---|---|---|
| Foggier | Mid-hill | 3.153 | 0.403 | 7.83 | 0 |
| High-hill | -0.683 | 0.491 | -1.39 | 0.16 | |
| Animal-Head | 0.133 | 0.045 | 2.93 | 0 | |
| Age-Log | 1.134 | 0.721 | 1.57 | 0.12 | |
| Poor | -0.538 | 0.356 | -1.51 | 0.13 | |
| Constant | -3.619 | 0.911 | 3.97 | 0 | |
| Chillier | Mid-hill | -0.395 | 0.258 | -1.53 | 0.13 |
| Area log | 0.47 | 0.169 | 2.78 | 0.01 | |
| Age-Log | 26.374 | 13.369 | 1.97 | 0.05 | |
| Age-log square | -3.319 | 1.736 | -1.91 | 0.06 | |
| Constant | -9.396 | 2.533 | 3.71 | 0 | |
| Hotter | Mid-hill | -0.579 | 0.302 | -1.92 | 0.06 |
| High-hill | -0.525 | 0.332 | -1.58 | 0.11 | |
| Area log | 0.523 | 0.184 | 2.85 | 0 | |
| Constant | -0.424 | 0.202 | 2.1 | 0.04 | |
| Increased rainfall | High-hill | 1.065 | 0.259 | 4.11 | 0 |
| Animal-Head | 0.045 | 0.032 | 1.4 | 0.16 | |
| Constant | -0.746 | 0.272 | 2.74 | 0.01 | |
| Decreased hail | High-hill | 1.13 | 0.274 | 4.13 | 0 |
| Influential ethnic group | 0.61 | 0.25 | 2.44 | 0.02 | |
| Constant | -7.871 | 2.922 | 2.69 | 0.01 |
Note: Log-likelihood function= -2548.149; BIC=5370.08 and 48 free parameters
Table 2: Factors determining the experiences of climate changes: foggier, chillier, hotter, less hail and more rainfall.
Table 2 shows that the probability of experiencing foggier winter weather is positively significantly associated with the mid-hill and animal-head variables. The results indicate that the individuals living in the mid-hill region and higher numbers of livestock holdings are more likely to experience foggier conditions. The results are logical in the context. In former days, winter fog was a common phenomenon only in the lower-hill region. It has now extended. The fog appearing cut-off elevation has shifted up and reached the foothills of mid-hill areas. One author who grew up in the mid-hill area has now also experienced foggier winter weather in his community. The literature also reports an increase in foggy winter days and fog incidence areas around the Gangetic plain in South Asia [40-42]. A higher number of animal holders are more likely to have experienced the foggier weather change because they are more likely to manage their livestock outdoor than others. Their memory of livestock management in fog-free winters in the past could have been well recalled while working in the murky-cold weather today.
The Area-log variable found significant with chiller experiencing. This means some large landholders might have experienced extreme weather because they spend more time on fieldwork and get more exposure to hotter weather. In the mountain context, the lands of small and medium farmers are not enough to employ fully on the farm which might have made the experiencing differences. Other variables such as mid-hill and household age are marginally significant which might be significant in large sample-based studies.
The coefficients of the high-hill, low-hill, and age variables are significant whereas the animal-head is significant in the case of experiencing chillier weather. To handle the problem of likelihood value conversion with the low hill variable, the high-hill, the midhill variables were included in the model. The negative relationship between the two variables implies that people living in high hill experienced hotter. Low hill is the foothill region where land heats and cools faster than other hill areas. The area consists of mesothermal climate, and the air temperature drops below 6°C on cold days. The low-hill belt is characterized by seasonal temperature inversion: colder in winter and hotter in summer than the midhill area. Extreme annual variations in temperature are typical of mesothermal climate [39]. Coldness, particularly in the morning, might have intensified in areas with increased fog intensity and incidence like low-lying areas in South Asia [40,41]. The result is similar to instrumental data-based study that minimum, as well as maximum temperature, decreased in some areas in mid-hill and Gangetic plain during the winter season [3,43]. Changes in the global climate or some other local situations might have created the hotness feeling of people in the low-hill. The study also showed that some Indian people are feeling hotter local environment over recent years [44]. Only a fraction or one-degree changes in environmental temperature levels may not make a noticeable difference in the hotness feeling of people unless other factors contribute to the environment [11,25,26]. Increasing atmospheric humidity might have played some roles in increasing the extreme feelings of the people. The humidity increasing affects the body cooling system (sensational overheating) and makes people feeling much hotter at the same temperature and wind speed levels [8,11] in the summer season. The significant positive coefficient value of the age variable is also meaningful because older people generally spent longer in the community and became able to affirm increases in both climate extremes (chillier and hotter).
The probability of experiencing decreasing hail found positively associated with elite ethnic groups and high-hill variables. The positive relationships with those variables are difficult to explain. However, the change on field crop damage trend might have reminded the ethnic group the hailstorm dynamic because the elite ethnic group possess more area of irrigated land-holding and hold more crop in the field relative to another ethnic group during hailstorm season [45]. The distinct relationship of the hail with midhill is logical in the sense that hailstorm is a common phenomenon of the high-hill as the hail formation requires low heights of the freezing level and strong upward motion of air. However, instrumental data-based studies in similar altitude regions (Tibet) show that the frequency of hailing is increased despite decreasing hail size [46,47]. However, change in climatic phenomena can be varied between regions [48]. The Himalayan wall has divided the study site and Tibet and influenced other climatic conditions too.
The purpose of the study was to elicit and demonstrate a theoretical framework guiding studies on human experience on climate change. The study proposed and explained the random experience model with mathematical illustration. The model is applied similarly to theoretical models of the economic field. Primarily the model dictates to evaluate the experience related factors that can explain changes of the climatic state between two periods. The application of the framework was demonstrated with a pilot study data of mountain farmers. The factors tested in the study can provide a reasonable basis for climate change in a local community. However, as a pilot study, this study has not collected and tested other important factors such as geospatial and farmers’ environmental exposure which could make the result more robust. For example, the study is also limited to a 450 m to 1530 m altitude range and has been done in only one community of each elevation belt. The response from further higher elevations and other communities at the same elevation would give more meaningful information. The theoretical framework guides researcher to develop much sophistical question structure and interviewing techniques which might help respondents for recalling past life situations, events, and experiences related to climate change. The strengths of the theoretical model can be elicited by addressing these weaknesses in future studies.
This study was completed at the personal expenses and voluntary time contribution of the authors. We would like to express the deepest appreciation to the farmers and some community leaders who took part in this survey and provided their valuable information.
The authors have no conflict of interest in the data and output.
Citation: Dhakal B, Bhattarai S, Dhakal N (2020) An Application of the Random Experience Theoretical Model for Investigating Local Climatic Changes in the Himalayan Mountain Region. J Climatol Weather Forecast 8:252.
Received: 16-Mar-2020 Published: 15-May-2020, DOI: 10.35248/2332-2594.2020.8.252
Copyright: © 2020 Dhakal B, et al. This is an open-access article distributed under the terms of the Creative Commons Attribution License, which permits unrestricted use, distribution, and reproduction in any medium, provided the original author and source are credited.
