PMC/PubMed Indexed Articles


Indexed In
- Academic Journals Database
- Open J Gate
- Genamics JournalSeek
- Academic Keys
- JournalTOCs
- China National Knowledge Infrastructure (CNKI)
- CiteFactor
- Scimago
- Ulrich's Periodicals Directory
- Electronic Journals Library
- RefSeek
- Hamdard University
- EBSCO A-Z
- OCLC- WorldCat
- SWB online catalog
- Virtual Library of Biology (vifabio)
- Publons
- MIAR
- University Grants Commission
- Geneva Foundation for Medical Education and Research
- Euro Pub
- Google Scholar
Useful Links
Share This Page
Journal Flyer

Open Access Journals
- Agri and Aquaculture
- Biochemistry
- Bioinformatics & Systems Biology
- Business & Management
- Chemistry
- Clinical Sciences
- Engineering
- Food & Nutrition
- General Science
- Genetics & Molecular Biology
- Immunology & Microbiology
- Medical Sciences
- Neuroscience & Psychology
- Nursing & Health Care
- Pharmaceutical Sciences
Research Article - (2019) Volume 11, Issue 3
A Semi-physiologically Based Model for Methylphenidate Pharmacokinetics in Adult Humans
Andre J Jackson*Received: 12-Apr-2019 Published: 24-May-2019, DOI: 10.35248/0975-0851.19.11.390
Abstract
To determine if a literature-sourced physiological model for immediate-release (IR) methylphenidate (MPH), with addition of parameters for extended-release (ER) absorption can be adapted for NONMEM analysis to describe extended-release MPH drug products (i.e., Concerta® ER 54 mg tablets and Ritalin-LA® 40 mg capsules) pharmacokinetics (PK) in adults.
This semi-physiological model will provide a platform to allow more accurate determination of Cmax in the analysis of methylphenidate plasma data from formulations with complex absorption. Adult reference data for total MPH plasma levels (summation of d- and l- enantiomers) were generated using individual subject parameters from a published NONMEM model for ER MPH (individual subject parameter generated data was used because the true experimental data is proprietary with only the previously-published summary parameters available for public use). The IR physiological model required analysis of both d- and l-MPH enantiomers which were estimated at each time point for the data by calculating the d/l enantiomer ratio from total MPH plasma concentration levels, based upon literature ratio estimates.
Absorption was characterized by a fast zero-order and a delayed slow first-order release. Consistent with the literature IR model, two duplicate physiological models were used to describe the d- and l-MPH enantiomers. The mean and variability ratios for the individual subject parameter-generated data/true experimental data were very close to 1.0. The predictive performance of the absorption-modified physiological model and its disposition parameters were demonstrated, as they described both the Concerta® and Ritalin LA® PK and Cmax values very well. The bias was less than 6% for Concerta® peaks while peak 1 for d-Ritalin LA® was 12.9% and peak 2, 7.5%. The IR MPH physiological model, adapted for NONMEM analyses of the ER MPH drug products Concerta® and Ritalin LA® described the individual parameter-generated reference data well for both formulations.
Keywords
Physiological model; Extended-release methylphenidate; Cmax; NONMEM; Concerta®; Ritalin LA®
Abbreviations
IR: Immediate-Release; ER: Extended-Release; MPH: Methylphenidate; ADHD: Attention Deficit Hyperactivity Disorder; FDA: Food and Drug Administration; CWRES: Conditionally Weighted Residuals
Introduction
A clear relationship has been established between MPH blood plasma concentration levels, their time course and clinical effect in treating ADHD, attention deficit hyperactivity disorder [1]. MPH is administered as a racemic mixture (1:1) of the threo pair of MPH isomers (i.e., d,l-threo MPH). However, upon absorption only a very small percentage of the l-isomer escapes first-pass resulting in plasma levels for the l-isomer being between 1 to 5% of total drug in the plasma. In addition, there is no plasma interconversion with all clinical efficacy being related the d-isomer concentrations [2]. This relationship is reflected in the labeled recommended bid, twice-a-day, and tid, three-times- a-day, dosing for the original IR MPH drug products. Today, there exist many approved ER MPH drug products which are effective for 24 hours with a single daily dose. It is now also apparent that not only is the extended release of MPH clinically important, but also that the pattern of release can impact the time course of efficacy throughout the day. This can be seen with the novel formulation, HLD 200 which can be evening-dosed [3]. Many published papers have discussed MPH pharmacodynamics (PD), but few have presented plasma curves and fitted parameters for a specific PK model especially based upon individual data [4]. A recent paper described a deterministic physiological IR model for oral and iv, intravenous, MPH dosing in several species, including humans, for d- and l- MPH [2]. This model was recently modified by the authors to describe the PK behavior of multiple ER MPH drug products in adults [5]. The ER characteristics were described by a complex transit model.
Another published study investigated the impact of carboxylesterase-1 enzyme and other covariates on the inter-subject variability for d- and l- MPH following oral administration of ER Ritalin LA®. This study used a 3-transit-compartment ER model in NONMEM to estimate population parameters [6]. The study was conducted in adult subjects using sparse and rich sampling. Despite the use of individual data, the authors were unable to adequately describe Cmax with the empirical model due to inadequate sampling.
The major problem with current published PK models is the inability of the mean data to adequately predict peak exposure [5- 7] and measure true inter-subject variability. The purpose of this paper is to modify this physiological model and apply it to the PK of publicly-available individual subject parameters derived from fitted individual adult subject data [2,8]. The potential importance of this work is evidenced by the recent controversy over the bioequivalence determination of generic Concerta® and the issuance of a new bioequivalence guidance for ER MPH oral drug products by the Food and Drug Administration (FDA) [9-11].
As referenced above, the current investigation aimed to change the absorption characteristics of the IR physiological model so that it could be applied to the ER MPH drug products Concerta® and Ritalin LA®, taking into consideration that each product has a definite curve shape related to its activity. Although the data used in this study is based upon plasma data obtained from individual subject parameters, the results are not totally theoretical, since the derived data is compared with the true experimental data. In addition, the model fits are validated by visual predictive check as would be done for experimental data [12].
ER MPH drug product labeling and published research articles have also discussed differences in oral absorption of MPH between adults and children and have noted that for Concerta® there is an increased apparent oral clearance in adolescents compared to children [13]. Despite inclusion of this information in the Concerta® drug product labeling, few definitive studies of the models and plasma curve profiles for these drug products have been reported in the literature comparing adults and children, although PK parameters have been presented [14- 17].
A valid ER MPH physiological model would allow definitive changes in parameters related to absorption, disposition and elimination to reflect differences between children and adults similar to what has been described for IR products using the IR physiological model. A new ER MPH semi-physiological model based upon individual subject data would be useful for conducting simulation studies, especially those related to BE, bioequivalence, PK, and PD in other populations of interest, especially considering that many pediatric ER MPH drug products have recently entered the US market [18].
Materials and Methods
IR-to-ER semi-physiological model changes and development
The original published IR physiological model has two identical eight compartments (i.e., plasma, fat, brain, richly perfused, slowly perfused, gonads, heart, and liver) models to allow one to quantify the d- and l- enantiomers of MPH [2]. In addition, it used two identical models to quantify the d- and l-ritalinic acid metabolites in the body. In the study, IR MPH was given orally or administered by iv infusion. The parameter values for Concerta® and Ritalin LA® are presented in Tables 1-3.
| Time hr | Mean %Bias Concerta® | Ratio Std(g)/Std(e) |
Ratio SE(g)/SE(e) |
Mean %Bias Ritalin LA® |
Ratio Ritalin Std(g)/Std(e) |
Ratio Ritalin SE(g)/SE(e) |
|---|---|---|---|---|---|---|
| 0.25 | * | * | * | * | * | * |
| 0.5 | * | * | * | * | * | * |
| 1 | 6.9 | 0.96 | 0.95 | -9.9 | 0.95 | 0.96 |
| 1.5 | 4.0 | 1.02 | 1.01 | 7.6 | 0.97 | 0.97 |
| 2 | -7.6 | 1.13 | 1.12 | 2.6 | 0.81 | 0.82 |
| 3 | 2.5 | 0.94 | 0.94 | -7.0 | 1.21 | 1.21 |
| 4 | 4.2 | 0.99 | 1 | 2.75 | 0.97 | 0.97 |
| 5 | 1.0 | 0.94 | 0.94 | -7.0 | 0.82 | 0.81 |
| 6 | -2.6 | 1.00 | 1 | 0.35 | 0.90 | 0.87 |
| 6.5 | -2.2 | 1.00 | 1 | 9.2 | 1.05 | 1.06 |
| 7 | -0.89 | 0.99 | 1 | 3.7 | 0.95 | 0.94 |
| 7.5 | -1.59 | 0.96 | 1 | 0.5 | 1.06 | 1.08 |
| 8 | 1.53 | 0.96 | 0.96 | -10.8 | 0.94 | 0.95 |
| 10 | 1.81 | 0.94 | 0.94 | -16.4 | 1.11 | 1.12 |
| 12 | 3.87 | 1.01 | 1.01 | 8.2 | 0.92 | 0.93 |
| 16 | -0.69 | 1.10 | 1.1 | 5.0 | 1.62 | 1.70 |
| 24 | -20.27 | 0.97 | 0.94 | 20.8 | 0.83 | 0.77 |
* There were too many missing values at 0.25 hr and 0.50 hr (LOQ-limit of quantitation) for the experimental data to calculate the mean concentrations for those time points with a sample size comparable to the other time points.
Table 1: Comparison of mean %bias at each time point for the true experimental data vs plasma data generated from the two-stage analysis of the original experimental data. The generated(g)/experimental(e)ratio for the total plasma concentration standard deviation and standard error at each time point is also presented.
| Parameter | Unit | Estimate | %RSE | 90% CI | Shrinkage (%) |
|---|---|---|---|---|---|
| K13 | h-1 | 0.71 | 0.44 | (0.70 0.72) | -------- |
| K23 | h-1 | 0.53 | 0.49 | (0.52 0.53) | -------- |
| K30 | h-1 | 1.07 | 0.14 | (1.07 1.08) | -------- |
| K34 Fixed | h-1 | 0.46 | 0.37 | (0.46 0.48) | -------- |
| D1 Fixed | hr | 0.34 | 1.01 | (0.33 0.36) | -------- |
| Alag2Fixed | hr | 3.86 | 0.12 | (3.85 3.88) | -------- |
| F1 Fixed | ---- | 0.42 | 0.05 | (0.41 0.43) | -------- |
| F2 Fixed | ---- | 0.57 | 0.04 | (0.56 0.59) | -------- |
| V Fixed | L | 4.24 | 0.28 | (4.10 4.30) | --------- |
| ω 2 K13 | 0.17 | 2.8 | (0.16 0.18) | 19 | |
| ω 2 K23 | 0.26 | 2.23 | (0.25 0.27) | 10 | |
| ω 2 K30 Fixed | 0.0002 | ----- | ------- | 94 | |
| ω 2 K34 | 0.06 | 1.97 | (0.03 0.09) | 8.8 | |
| ω 2 D1 | 0.52 | 2.26 | (0.52 0.57) | 13 | |
| ω 2 Alag2 | 0.006 | 5.27 | (0.005 0.007) | 37 | |
| ω 2 F1 | 0.01 | 10.2 | (0.008 0.012) | 60 | |
| aSD, RES prop | ---- | 0.1Fixed | |||
| SD, RES additive | ---- | 1.1Fixed |
aSD, standard deviation associated with the respective residual error.
Table 2: NONMEM Parameter Estimates for d-Concerta® for the Final Model. All are typical values (TV) with relative standard error (%RSE), 90% confidence intervals (CI), the variance estimate (ω) for inter-subject variability, and shrinkage (ƞ).
| Parameter | Unit | Estimate | %RSE | 90% CI | Shrinkage(%) |
|---|---|---|---|---|---|
| K13 | h-1 | 1.45 | 1.44 | (1.42 1.47) | |
| K23 | h-1 | 5.63 | 0.74 | (5.59 5.66) | ----------- |
| K30 | h-1 | 0.95 | 0.94 | (0.94 0.96) | ----------- |
| K34 | h-1 | 0.4 | 0.54 | (0.39 0.42) | ----------- |
| D1 | hr | 0.24 | 2.13 | (0.22 0.26) | ----------- |
| Alag2Fixed | hr | 4.73 | ------ | --------- | ----------- |
| F1 | ---- | 0.61 | 0.15 | (0.60 0.63) | ----------- |
| F2 | ---- | 0.39 | 0.25 | (0.36 0.40) | ----------- |
| V11 Fixed | L | 4.4 | ------- | --------- | ------------ |
| ω 2 K13 | 0.78 | 5.87 | (0.75 0.81) | 40 | |
| ω 2 K23 Fixed | 0.9 | ------ | --------- | 4.3 | |
| ω 2 K30 | 0.68 | 5.8 | (0.64 0.71) | 21 | |
| ω 2 K34 | 0.037 | 10.4 | (0.03 0.45) | 35 | |
| ω 2 D1 | 0.06 | 9.5 | (0.03 0.08) | 55 | |
| ω 2 Alag2 | 0.024 | 4.77 | (0.02 0.03) | 50 | |
| ω 2 F1 | 0.065 | 10.47 | (0.03 0.08) | 30 | |
| aSD, RES prop | ---- | 0.1Fixed |
aSD, standard deviation associated with the respective residual error.
Table 3: NONMEM Parameter Estimates for d-Ritalin LA® From the Final Model with ƞ Shrinkage. All are typical values with relative standard error, 90% confidence intervals, ω the variance estimate for inter-subject variability.
The first change made to the basic IR physiological model structure was to add an arterial and plasma compartment to provide a more accurate physiological representation of organ perfusion. The second modification was to establish two parallel stomach compartments, one to reflect rapid zero-order absorption, K13, into the intestine with a duration of D1, and a second to reflect delayed first-order intestinal absorption K23. The delayed input was controlled by a lag time on compartment 2 (alag2) to accommodate the ER portion of the formulation. Intestinal egress remained the same (i.e., oral uptake, K34, plus gut metabolism, K30) as in the original IR model. The third and final revision to the IR model, deleted the quantification of ritalinic acid via the one-compartment model, but maintained the hydrolysis and oxidation functions of the liver. The final ER MPH NONMEM model is shown in Figure 1 and a diagram of procedural steps in Figure 2.

Figure 1: The final ER MPH NONMEM model.

Figure 2: Diagram of procedural steps involved in ER MPH NONMEM model.
Disposition parameters for the ER MPH NONMEM model were the same as those from the literature for the original IR physiological study which used mean data [2], with the exception of the parameter describing gut metabolism (i.e., K30) was changed from K30 0.75, as presented in Table 3 of the referenced publication, to K30 -0.25, since gut metabolism is not clearance related [19]. Thus, K30 did not return ritalinic acid to the body as did the published model. The Concerta® metabolism variance (omega) was fixed to a very small value in the ER MPH NONMEM semi-physiological model to avoid numerical difficulties during parameter estimation. However, parameters for duration of absorption and oral uptake, which were not in the published IR MPH model, were estimated by NONMEM (Advan 13 and Trans 4). For Ritalin LA®, only the variance (omega) for the slow first-order absorption was fixed.
Data generation and equivalency to experimental data
Methylphenidate is administered as a 1:1 racemic mixture of d- and l- enantiomers which do not interconvert. The d- enantiomer is ten times more potent than the l- form and accounts for approximately 95% of observed total MPH plasma levels [20].
Total MPH individual subject plasma concentration data for the 54 mg Concerta® (N=34) and 40 mg Ritlain LA® (N=19) study was generated via simulation in NONMEM using the best-fit individual subject parameters and the published ER MPH NONMEM model, based upon the two-stage data analysis [8]. The aim of the current study was to follow the original experimental data as closely as possible; therefore, sampling times of 0 (pre-dose), 0.25, 0.50, 1, 1.5, 2, 3, 4, 5, 6, 6.5, 7, 7.5, 8, 10, 12, 16, and 24 h post-dose were established.
To help assure the equivalency of the individual subject parameter generated data to the experimental data, the mean percent bias and the ratio of the standard deviations and standard errors at each time point were calculated for the generated versus experimental total MPH plasma concentration data for the mean individual subject time points from the two-stage analysis for Concerta® and Ritalin LA®.
The literature IR MPH physiological model was based upon separate in vivo d- and l- enantiomer MPH plasma concentrations [2,5]. Therefore, the generated individual total MPH plasma levels from the two-stage analysis had to be converted to d- and l- MPH plasma levels.
The Figures 1 and 2 presented in reference [21] indicates a fairly constant ratio between total MPH and the d and l isomers.
The GETData™ program [22] was used to digitize graphs from the published IR MPH physiological model [2] and the work by Srinivas et al., to obtain data from the publications. These digitized data were used to determine the mean d/l MPH enantiomer ratios based upon the fitted and observed results for each time point [21]. These results were then used to calculate the d/l MPH enantiomer ratio at each time point from the total MPH data generated for the individual subjects from the two-stage analysis.
Demographic data
The following demographic data from the submitted Concerta® and Ritalin LA® studies were also used for the generated data.
Submitted Concerta® study: Mean subject weight was 189 lb. (range = 136 - 313 lb.). Subjects aged 18-40 comprised 80% of total, while subjects aged 41-60 comprised 20% of total. Twenty-two male and 14 female subjects participated in the study.
Submitted Ritalin LA® study: Mean subject weight was 195 lb. (range 136 – 320 lb.). Subjects aged 18-40 comprised 80% of total, while subjects aged 41-60 comprised 20% of total. Ten male and nine female subjects participated in the study.
Pharmacokinetic analysis
The experimental data had been previously analyzed to develop the previously published empirical model for MPH. This model provided individual subject parameters. Based upon these individual parameters, virtual individual plasma concentrations were generated via simulation for each subject using the empirical published model. These simulated individual concentration-versus-time d- and l- MPH data for the ER model for Concerta® and Ritalin LA® were simultaneously analyzed with the nonlinear mixed-effects software NONMEM version 7.21 based upon the ER semi-physiological structural model. The first-order conditional estimation method with interaction was employed for parameter estimation. The extent of shrinkage of empiric Bayesian parameter estimates obtained from NONMEM was used to determine the degree of bias associated with the estimation any particular PK parameter in any subsequent exploratory modeling. The same analysis was conducted for Ritalin LA®. The fixed and estimated parameters are delineated in Tables 3 and 4 for Concerta® and Ritlain LA® d-MPH, respectively. The same parameters were fixed for l-MPH.
Pharmacostatistical models
D-MPH: Since the d-MPH is the active species, it was modeled as follows:
The inter-subject variability for all d-MPH PK parameters was assumed to be lognormally distributed:
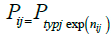 (1)
(1)
with
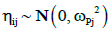 (2)
(2)
Where: Pj is the typical value for the jth parameter in the population, Pij is the individual value for the jth parameter in the ith subject, and nij is a random variable in the jth parameter with a mean of zero and a variance of ωPj2. The model assumes that the Pij values are log-normally distributed. Intersubject variability in Pj was modeled as the square root of ωPj2, which approximated the coefficient of variation Pj for a log-normally distributed quantity.
An additive residual error model, a proportional residual error model, and a combination of the two (equation 3) were tested for d-MPH. The combination error model is given by:
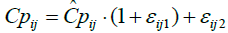 (3)
(3)
where  is the jth individual predicted concentration at the ith time, and εij1 is the random variable that quantifies the deviation of the predicted concentration from the observed concentration in a manner dependent on the magnitude of the prediction. εij2 is the random variable that quantifies the deviation of the predicted concentration from the observed concentration in a manner that is additive to the magnitude of the prediction. The variance for
  , while for εij2, the variance is σ22. For d-Ritalin there was no additive εij2 in the residual error model.
The relative amounts of drug dose available from fast release compartment-1 (F1) and the relative amount in the lagged compartment-2 (F2) were estimated by NONMEM for the virtual subjects.
L-MPH: Since this species is ten times less active and with reported AUC values 10- to 40-fold lower than for d-MPH, only population values were used to represent the l-MPH concentrations (i.e., Pij = Ptyp) in the model. An additive residual error model, a proportional residual error model, and a combination of the two (equation 3) were also tested for l-MPH, with the combination residual error model given as in equation 3.
Model evaluation: Goodness-of-fit plots were generated for individual predictions, population predictions, and individually-weighted, residual-versus-time plots using R for Concerta® and Ritalin LA®.
Predictive performance: The model validation for Concerta® and Ritalin LA® was done using the visual predictive check. This was performed by simulating in NONMEM 1,000 data sets using the parameter estimates from the final best fit model. The NONMEM-generated simulations were then analyzed using SAS® University Edition to give the respective 95% prediction intervals. These 95% prediction intervals, around the 5th, 50th, and 97.5th prediction percentiles of the simulated data were plotted and finally the observed 5th, 50th, and 97.5th values were then overlaid on the plot of the prediction intervals.
Estimation of parameter standard errors and prediction intervals
As a consequence of rounding errors, the NONMEM covariance step was not successful, which resulted in the inability to calculate asymptotic standard errors. NONMEM with the UNCOND option was also unsuccessful. However, the models ran successfully when the covariance was not implemented. Therefore, the standard error for the parameter estimates was determined by bootstrapping (i.e., generating pseudo-samples distributed according to the same distribution as the original samples). At least 200 bootstrap replicates were generated to yield at least 150 successful runs. Due to the long run times (up to 5 days), 150 bootstrap analyses were generated with the honest standard error calculated using standard formulas [19,23-25]. Runs that did not have 3 significant figures were discarded. The 90% prediction intervals were calculated based upon the standard error values for each parameter.
Estimation of Cmax - literature vs semi-physiological model
The individual parameter-derived data (i.e., dependent variable) at Cmax1 and Cmax2 for each subject for Concerta® and Ritalin LA® was compared to the values predicted by the semi-physiological model. This allowed a comparison of the semi-physiological model parameter estimation accuracy (measured as per cent bias) relative to parameter values reported in published population models where the authors made a similar comparison of their Cmax1 and Cmax2 values to the model-generated Cmax1 and Cmax2 values [2,5,6].
Results
Data equivalency - total methylphenidate
The mean per cent bias associated with the mean total MPH plasma values generated from the two-stage analyses of individual subject parameters compared to the true experimental data at each time point is presented in Table 1.
Results indicated that other than at 24 hr., the per cent bias for the mean total concentrations as a function of time was less than 10% for Concerta® and Ritalin LA® and most ratios for the standard deviation and standard error were near 1. Fewer subjects had measurable concentrations at the 24 hr time point when compared with other time points, hence the >10% bias.
Parameter estimation for D-Methylphenidate - concerta® and Ritalin LA®
The parameter estimation process for Concerta® and Ritalin LA® converged successfully using the first-order conditional estimation method with interaction. Three significant digits were requested in parameter estimation. The final parameter estimates are shown in Table 2 for Concerta® and Table 3 for Ritalin LA® with the corresponding estimates of standard error and 90% CIs. Standard error was estimated via bootstrapping.
Model evaluation for D-Methylphenidate - Concerta ® and D-Ritalin LA®
The goodness-of-fit plots for Concerta® (Figure 3) and Ritalin LA® (Figure 4) concentrations showed reasonable correlation between predicted and observed data for population versus individual predictions over time. However, there was some underprediction of the concentrations for the population predictions for Concerta and Ritalin above 10 and 12 ng/ml respectively.

Figure 3: Model evaluation for D-Methylphenidate - Concerta ®.

Figure 4: Model evaluation for D-Methylphenidate - D-Ritalin LA®
A plot of the conditionally weighted residuals (CWRES) also showed a reasonable uniform distribution around 0. The population PK parameters were estimated with minimal shrinkage, Table 2, except for K30 and F1 for Concerta® indicating that all other parameters would be informative. For Ritalin LA®, Table 3, only K23 and K30 had shrinkage values near or below 20% and thus only these two would be informative. Parameters K13, D1, and Alag2 had shrinkage above 35% for Ritalin LA are due to the fact that not enough samples were collected in the region of the PK profile that contains information for the efficient estimation of these parameters.
Model validation - concerta® and D-Ritalin LA®
A visual check indicated that the physiological model adequately described Concerta® data (Figure 5), and for Ritalin LA® (Figure 6).

Figure 5: Physiological model adequately described Concerta® data.

Figure 6: Physiological model adequately described Ritalin LA®.
Figures 5 and 6 indicate that the models are transportable [26].
Cmax estimation - semi-physiological model
The mean per cent bias estimates for peaks 1 and 2 for Concerta® and Ritalin LA® are presented in Table 3.
The bias was less than 6% for all Concerta® peaks while only peak 1 for d-Ritalin LA® was slightly more than 13%.
Discussion
The rationale for using individual parameter-generated data for this study was that the true individual experimental data was proprietary with only the fitted parameters [8] and previous comparisons between true and individual subject parameter-generated data available for current use. Based upon the data source, the establishment of data similarity was essential. This was addressed by the following:
1. For Concerta®, and for Ritalin LA® the mean per cent bias was less than 10% at all time points except at 24 hr, and ratios of their true/generated mean standard deviations and standard errors were near 1, respectively, at all time points:
2. Comparison of the variance between the 2-stage [8] and population modelling of the data often indicates that the variance of the two-stage parameters.
3. is inflated compared to that of the population parameters [27]. This was the case for all but two Concerta® parameters (K23, kaslow (first-order absorption process) for compartment 2, and D1, duration of zero-order absorption from the fast-release compartment) and one of the Ritalin LA ® parameters (F1). This may be related to small differences between the true and generated data observed throughout the time course of sampling.
There has been continued interest in MPH drugs following reports of problems with Kudco and Mallinckrodt ER MPH drug products and subsequent actions taken by the FDA [9]. These problems were documented in articles published in the Wall Street Journal [10] in 2014. The FDA issued a new final guidance in 2014 for the conduct of BE studies for ER MPH products [11] which attempted to address the variability issue by changing the recommended study design from the standard two-way crossover to a fully-replicated, four-period study. Some ER generic MPH drug products have been approved using this new protocol [18].
Several models have been presented in the literature to define the concentration-time curve shape for MPH formulations [2,5-7]. Model performance for MPH is measured by being able to clearly characterize the following variables (i.e., input rates, and the therapeutic Cmax values or partial areas which are inclusive of Cmax).
A recent article [7] evaluated three models for ER MPH products using mean data. It was found that a convolution method that could define the in vitro dissolution and in vitro release rates worked well. The method used a double Weibull function to define the slow and fast drug release for Concerta®. The proposed method was focused on optimal design, but it was pointed out that the meta-analysis used provided a reliable estimate of only mean population parameters but not of random effect parameters, which are important for extrapolation to other populations. This may be a significant concern, given the higher inter-subject variability observed for some MPH formulations in children (Figure 3, FDA, Food and Drug Administration, review [28]. Additional authors have also noted differences for MPH absorption and variability between subject groups based upon age and weight [16].
Two MPH models not addressed in the work done by Gomeni et al. [7] have been recently published [5,6]. These are addressed by defining fast and slow release Cmax values for several ER MPH formulations. Lyauk et al. [6] developed a population model for MPH using Ritalin LA® to study the impact of the CES1 single nucleotide polymorphism on MPH metabolism. The study was done because of the reported significant correlation between MPH concentration and clinical response. However, in the paper’s supplemental materials section 3.2, the authors discussed their “inability to estimate variations in maximal plasma concentrations (Cmax) due to the very sparse sampling used in study II.” They concluded that this failure may be related to their reported model shrinkage and that their results “should therefore be viewed as preliminary and further studies need to be conducted to validate the findings.” This clearly shows how important Cmax determination is for a MPH model. This is because Cmax, similar to AUC, is a measure of exposure. Therefore, it can affect drug efficacy and, potentially, the occurrence of adverse effects in users.
The ER physiological model which analyzed mean data [5] also looked at the model’s performance in predicting Cmax for Ritalin LA®, with a factor of no more than 2-fold error deemed to be acceptable. The results indicated that observed peak plasma concentrations were under-predicted by 2- to 2.6-fold with some peak mean values (at 16 and 24 hr.) exceeding a 3-fold difference from observed mean values.
The current modification of the physiologic model [2] developed in NONMEM based upon the estimation of parameters from individual subject fitting better predicted the true Cmax in the generated base data than did the other published models for their base data. These results are supported by the low shrinkage values associated with most of the absorption parameters for Concerta® and Ritalin LA® The per cent bias was less than 6% for peak 1 and peak 2 for Concerta® and less than 13% for Ritalin LA® which is far less than reported for the other models [5,6].
In studies required for approval of generic ER MPH drug products, adults are used to assess BE in children since it is assumed that absorption and elimination are the same. However, a question remains whether that assumption holds true for MPH drug products with complex absorption especially in association with food, since some of these drug products are being prescribed for children as young as 4 years of age. A recent paper [16] showed that age significantly affected absorption and metabolism of MPH. The authors concluded that preschool-aged children had greater exposure than school-aged children when given the same weight-adjusted dose.
A model has been published based on use of the MPH ER drug product Aptensio XR® [29] in school age children but additional investigations of PK and PD in ER MPH drug products are needed, especially in regard to the use of these products in pediatric populations, since many newly-approved formulations are used in that demographic.
Use of the current model may allow researchers to perform simulations that are more physiologically relevant. This, in turn, may permit a better examination not only of plasma curve shape but contrast tissue uptake which could lead to a more granular approach for the brain for development of a more suitable quantitative pharmacology model related to efficacy.
Because the data differences (i.e., generated vs. true experimental) observed were relatively minor, this study demonstrates the utility of the ER semi-physiological model developed here. The individual parameter-generated data used in this study had less than 10% bias, while the mean and variability ratios for the individual subject parameter-generated data/true experimental data were very close to 1.0. Therefore, it is deemed highly likely that the ER semi-physiological model developed here would perform equally well using actual experimental data.
Conclusion
A literature based-physiological model for IR MPH drug products in adult humans was adapted to the NONMEM platform. This new adapted ER semi-physiological model should (despite its limitation of using individual subject parameter generated data) allow one to better characterize not only the absorption characteristics and exposure (i.e., Cmax) of studied populations, but also their metabolism and tissue disposition, compared to other currently-available models. Therefore, for those who have access to individual subject data, this ER semi-physiological MPH model should provide a more complete and rigorous way to explore the PK of new ER MPH drug product formulations and evaluate their use in adult populations.
Acknowledgements
The author would like to thank Xiaoxia Yang and Jeffrey W. Fisher for their help in supplying the detailed equations from their original publication and to Larry Ouderkirk and Ene I. Ette for editing and reviewing this manuscript, respectively. April Braddy helped in drawing Figure 1.
REFERENCES
- Lopez F, Silva R, Pestreich L, Muniz R. Comparative efficacy of two once daily methylphenidate formulations Ritalin LA and Concerta and placebo in children with attention deficient disorder across the school day. Pediatr Drugs. 2003;5(8):545-555.
- Yang X, Morris SM, Gearhart JM, Ruark CD, Paule MG, Slikker W, et al. Development of a physiologically based model to describe the pharmacokinetics of methylphenidate in juvenile and adult humans and nonhuman primates. Plos One. 2014;9(9):e106101.
- Childress A, Mehrotra S, Gobbura J, McLean A, DeSousa NJ, Incledon B. Single-Dose pharmacokinetics of HLD200, a delayed-release and extended-release methylphenidate formulation, in healthy adults and in adolescents and children with attention-deficit/hyperactivity disorder. J Child Adol Psychopharmacol. 2017;28(1):10-18.
- Swanson J, Gupta S, Guinta D, Flynn D, Agler D, Lerner M, et al. Acute tolerance to methylphenidate in the treatment of attention deficit hyperactivity disorder in children. Clin Pharmacol Ther. 1999;66(3):295-305.
- Yang X, Duan J, Fisher J. Application of physiologically based absorption modeling to characterize the pharmacokinetic profiles of oral extended release methylphenidate products in adults. Plos One. 2016;11(10):e0164641.
- Lyauk YK, Stage C, Bergmann TK, Ferrero-Milliani L, Bjerre D, Thomsen R, et al. Population pharmacokinetics of methylphenidate in adults emphasizing novel and known effects of several carboxylesterase 1 CES1 variants. Clin Transl Sci. 2016;9(6):337-345.
- Gomeni R, Bressolle-Gomeni FMM, Spencer TJ, Faraone SV, Fang L, Babiskin A. Model-Based approach for optimizing study design and clinical drug performances of extended-release formulations of methylphenidate for the treatment of ADHD. Clin Pharmacol Ther. 2017;102(6):951-960.
- Jackson A. Impact of release mechanism of the pharmacokinetic performance of PAUC metrics for three methylphenidate products with complex absorption. Pharm Res. 2014;31(1):173-181.
- https://www.fda.gov/drugs/drugsafety/ucm422568.htm
- http://www.stltoday.com/business/local/mallinckrodt-takes-on-fda-in-fight-over-adhd-generic/article_2076ae1f-419d-5c34-98f6-4edaddb9cbd6.html
- https://www.fda.gov/downloads/drugs/guidancecomplianceregulatoryinformation/guidances/ucm320007.pdf
- Wang DD, Zhang S. Standardized visual predictive check versus visual predictive check for model evaluation. J Clin Pharmacol.2012;52(1):39-54.
- http://www.accessdata.fda.gov/drugsatfda_docs/label/2013/021121s032lbl.pdf
- http://www.accessdata.fda.gov/drugsatfda_docs/label/2013/021284s023lbl.pdf
- Van Stralen JP. The clinical impact of switching attention deficit hyperactivity disorder patients from OROS=MPH to Novo-MPH ER-C:a pediatric practice review. Pediatr Child Health 2013;18:70-73.
- Wigal SB, Gupta S, Greenhill L, Posner K, Lerner M. Pharmacokinetics of methylphenidate in preschoolers with attention-deficit/hyperactivity disorder. J Child Adol Psychopharmacol. 2007;17:153-164.
- Maldonado R. Comparison of the pharmacokinetics and clinical efficacy of new extended-release formulations of methylphenidate. Expert Opin Drug Met Toxicol. 2013;9(8):1001-1014.
- http://www.accessdata.fda.gov/scripts/cder/ob/docs/tempai.cfm
- Holford N, Heo YA, Anderson B. A pharmacokinetic standard for babies and adults. J Pharm Sci. 2013;102(9):2941-2952.
- Heal DJ, Pierce DM. Methylphenidate and its isomers:their role in the treatment of attention-deficit hyperactivity disorder using a transdermal delivery system. CNS Drugs. 2006;20(9):713-738.
- Srinivas NR, Hubbard JW, Quinn D, Korchinski ED, Midha KK. Extensive and enantioselective presystemic metabolism of dl-threo-methylphenidate in humans. Prog Neuro-Psycjopharmacol and Biol Pyschiatry. 1991;15(2):213-220.
- http://www.getdata-graph-digitizer.com
- Boeckmann AJ, Beal SL, Sheiner LB 1999 NONMEM users guide. University of California at San Francisco, San Francisco, CA.
- Ette EI, Onyiah LC. Estimating Inestimable standard errors in population pharmacokinetic studies: The bootstrap with Winsorization. Eur J Drug Metab Pharmacokinet. 2002;27:213-224.
- Vu CV, Nutt JG, Holford NHG. Progression of motor and nonmotor features of Parkinson’s disease and their response to treatment. Br J Clin Pharmacol. 2012;74(2):267-283.
- Ette EI, Williams PJ, Kim YH, Lane JR, Liu MJ, Capparelli EV. Model appropriateness and population pharmacokinetic modeling. J Clin Pharmacol. 2003;43(6):610-623.
- Sheiner LB. The population approach to pharmacokinetic data analysis:Rationale and standard data analysis methods. Drug Metab Rev. 2008;15(1-2):153-171.
- https://www.accessdata.fda.gov/drugsatfda_docs/nda/2015/205831Orig1s000ClinPharmR.pdf
- Teuscher NS, Adjei A, Finding RL, Greenhill LL, Kupper RJ, Wigal S. Population pharmacokinetics of methylphenidate hydrochloride extended-release multiple-layer beads in pediatric subjects with attention deficit hyperactivity disorder. Drug Design Develop Therapeut. 2015;9:2767-2775.
Citation: Jackson AJ (2019) A Semi-physiologically Based Model for Methylphenidate Pharmacokinetics in Adult Humans. J Bioequiv Availab 11:390. doi: 10.35248/0975-0851.19.11.390
Copyright: © 2019 Jackson AJ, et al. This is an open-access article distributed under the terms of the Creative Commons Attribution License, which permits unrestricted use, distribution, and reproduction in any medium, provided the original author and source are credited.